Representational Similarity Analysis (RSA, Kriegeskorte et al. 2008) is at the heart of our comparison metric for the Algonauts challenge. It is a technique that can map models, fMRI, and MEG data to a common similarity space to enable comparison. To explain the RSA process we'll use a small image set (N=4) for simplicity and take you through the two main stages.
First, neural activities in the brain or unit activities in models are summarized in the form of representational dissimilarity matrices (RDMs). These RDMs serve as a common space to relate models and the brain. We use correlation distances as the dissimilarity measure to create RDMs from fMRI, MEG and models.
Figure 1 shows this process of generating RDMs. Four input images are converted into the appropriate representational pattern for whichever signal space we are considering. This is done by taking activity from neurons (MEG), voxels (fMRI), or model units (model) and representing them as activity vectors. Once vectorized, the activity patterns for each image can be compared by computing the dissimilarity (1 minus correlation). The dissimilarity for every possible pair of images is computed to build the final 4x4 RDM, which gives a measure of how similarly (or dissimilarly) the four images are represented for a given signal space.
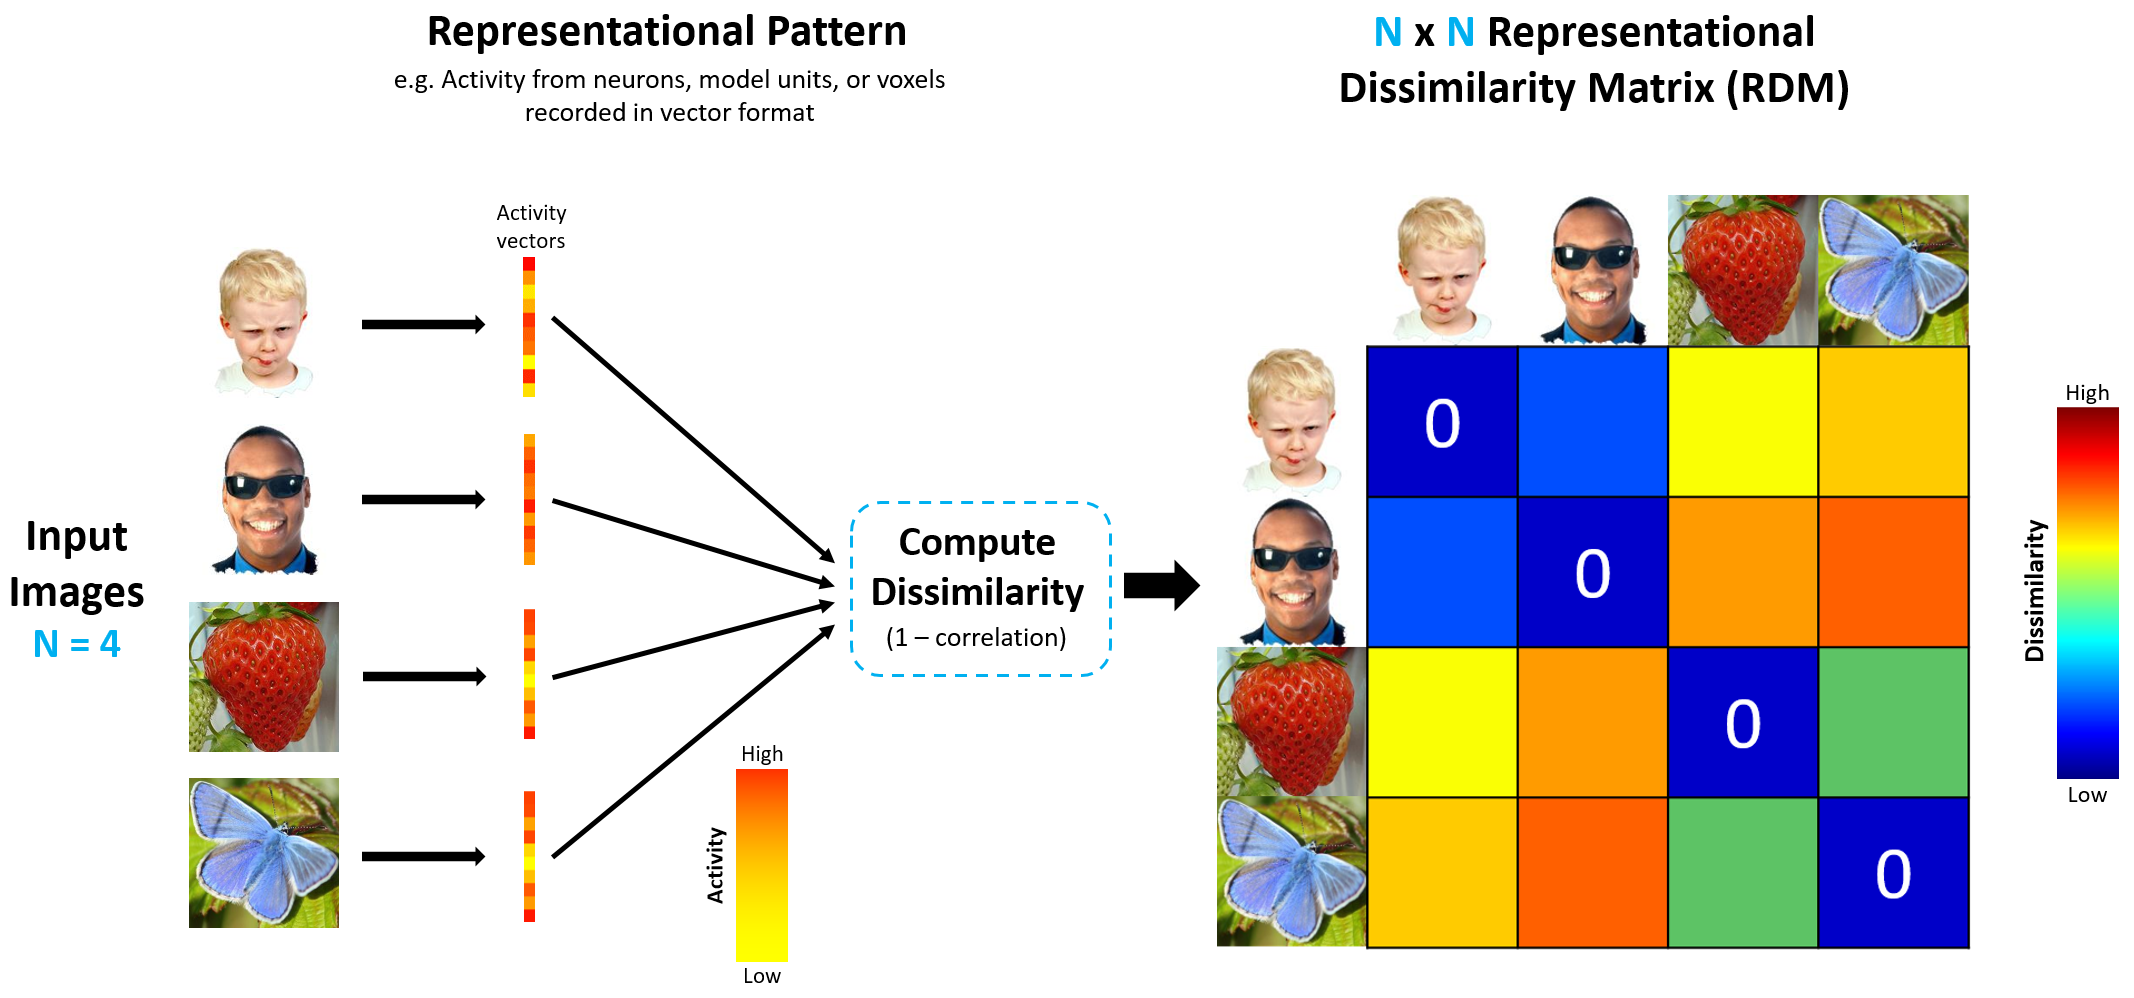
Figure 1: Generating RDMs
The next stage (illustrated in Figure 2) is to compare these brain and model RDMs. For each signal space (MEG, fMRI, model), we go through the process of generating RDMs as discussed in Stage 1. The fMRI RDMs are calculated for different brain regions (e.g. EVC and IT) whilst MEG RDMs are calculated for different time intervals (e.g. early and late stages of visual processing). Model RDMs are created from model unit activation patterns extracted from each layer of the neural network. The fact that RDMs are directly comparable (e.g. through Spearman's correlation) becomes key now, and is what facilitates integration across signal spaces. We simply compare model RDMs with MEG RDMs for the two time intervals (or with fMRI RDMs for the two brain regions) to yield noise normalized squared correlational scores which illustrate the model's explanatory power of the brain data over time (or space).
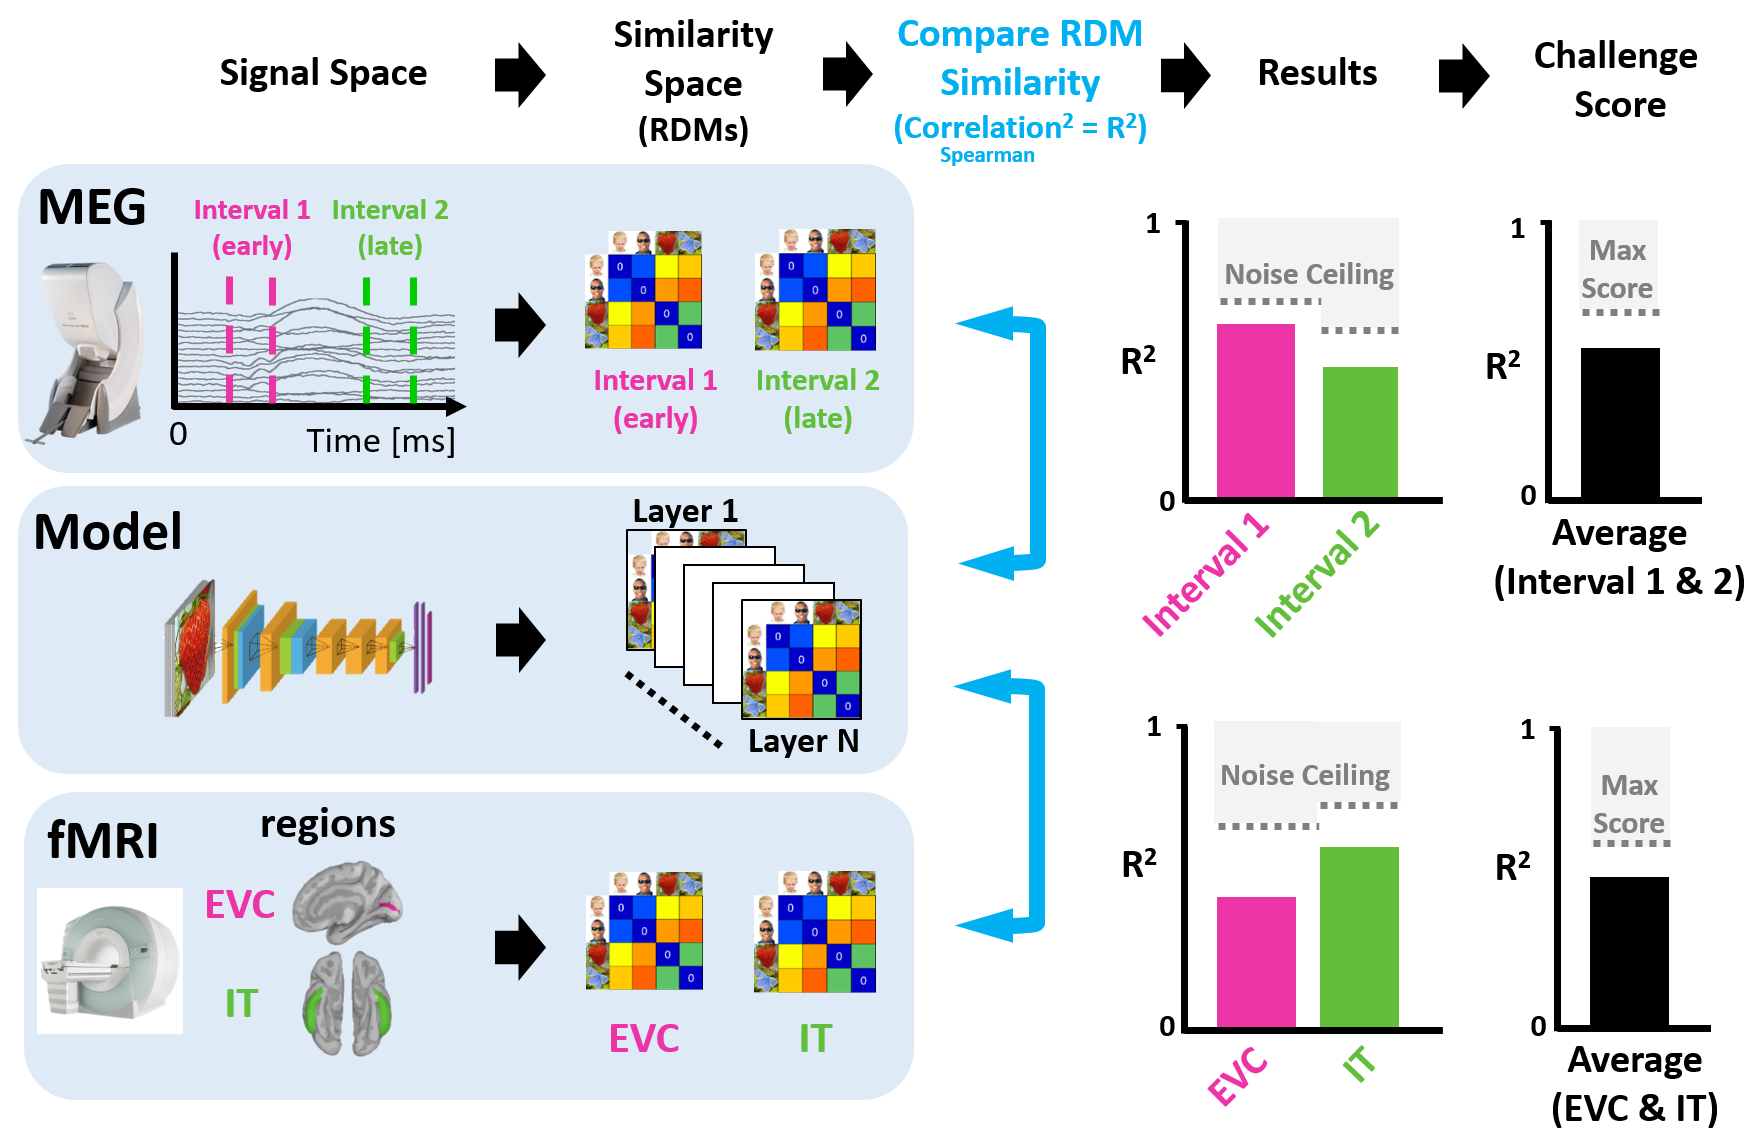
Figure 2: Comparing RDMs Across Signal Space