Understanding how the human brain works is one of the key challenges that science and society face. The Algonauts Challenge proposes a test of how well computational models do today. This test is intrinsically open and quantitative. This will allow us to precisely assess the progress in explaining the human brain.
At every blink our eyes are flooded by a massive array of photons—and yet, we perceive the visual world as ordered and meaningful. The primary target of the 2023 Challenge is predicting human brain responses to complex natural visual scenes, using the largest available brain dataset for this purpose.
Watching a visual scene activates large swathes of the human cortex. We pose the question: How well does your computational model account for these activations?
Watch the first video above for an introduction to the Algonauts 2023 Challenge and a detailed walkthrough of the development kit. When you are ready to participate, the second video will guide you through the CodaLab competition submission process.

The main goal of the Algonauts Project 2023 Challenge is to use computational models to predict brain responses recorded while participants view complex natural visual scenes.
Current computational models in AI are parameter rich and data-hungry. We thus partner with the Natural Scenes Dataset (NSD) team to provide the largest available set of brain responses to complex natural scenes. The NSD provides brain responses from 8 human participants to in total 73,000 different visual scenes. The brain responses were measured with functional MRI.
Learn more about the stimuli and fMRI dataset used in the 2023 Challenge
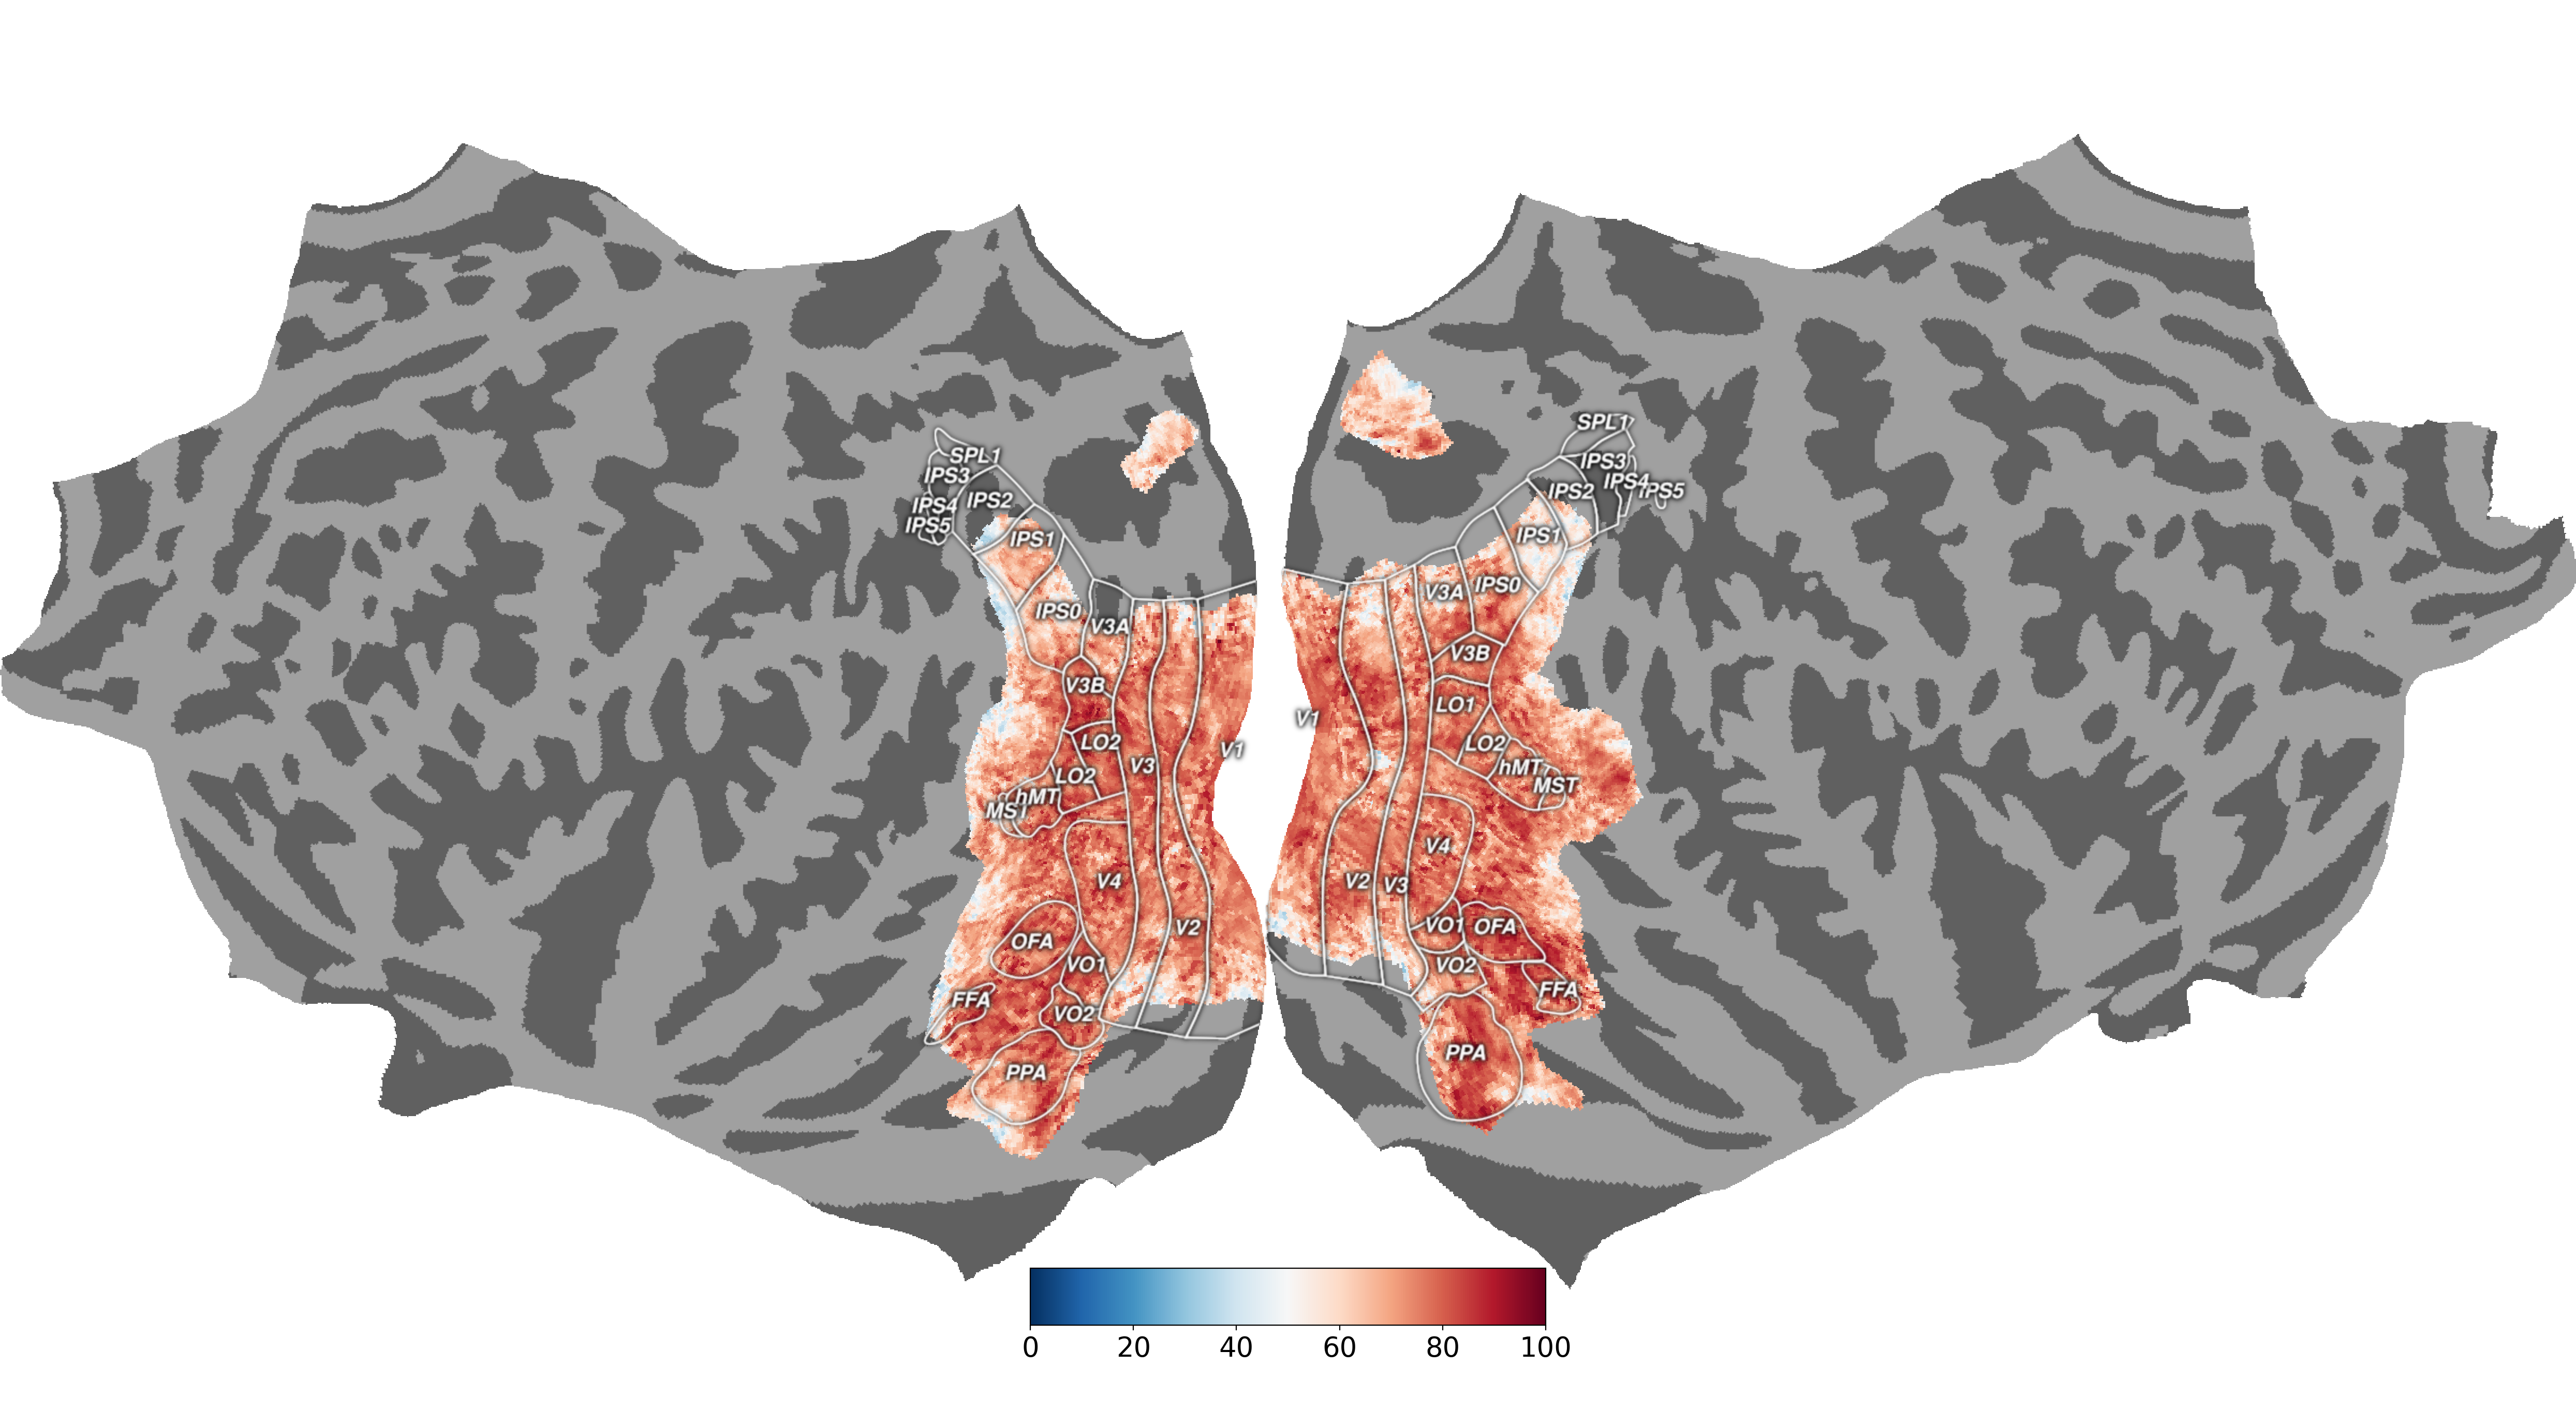
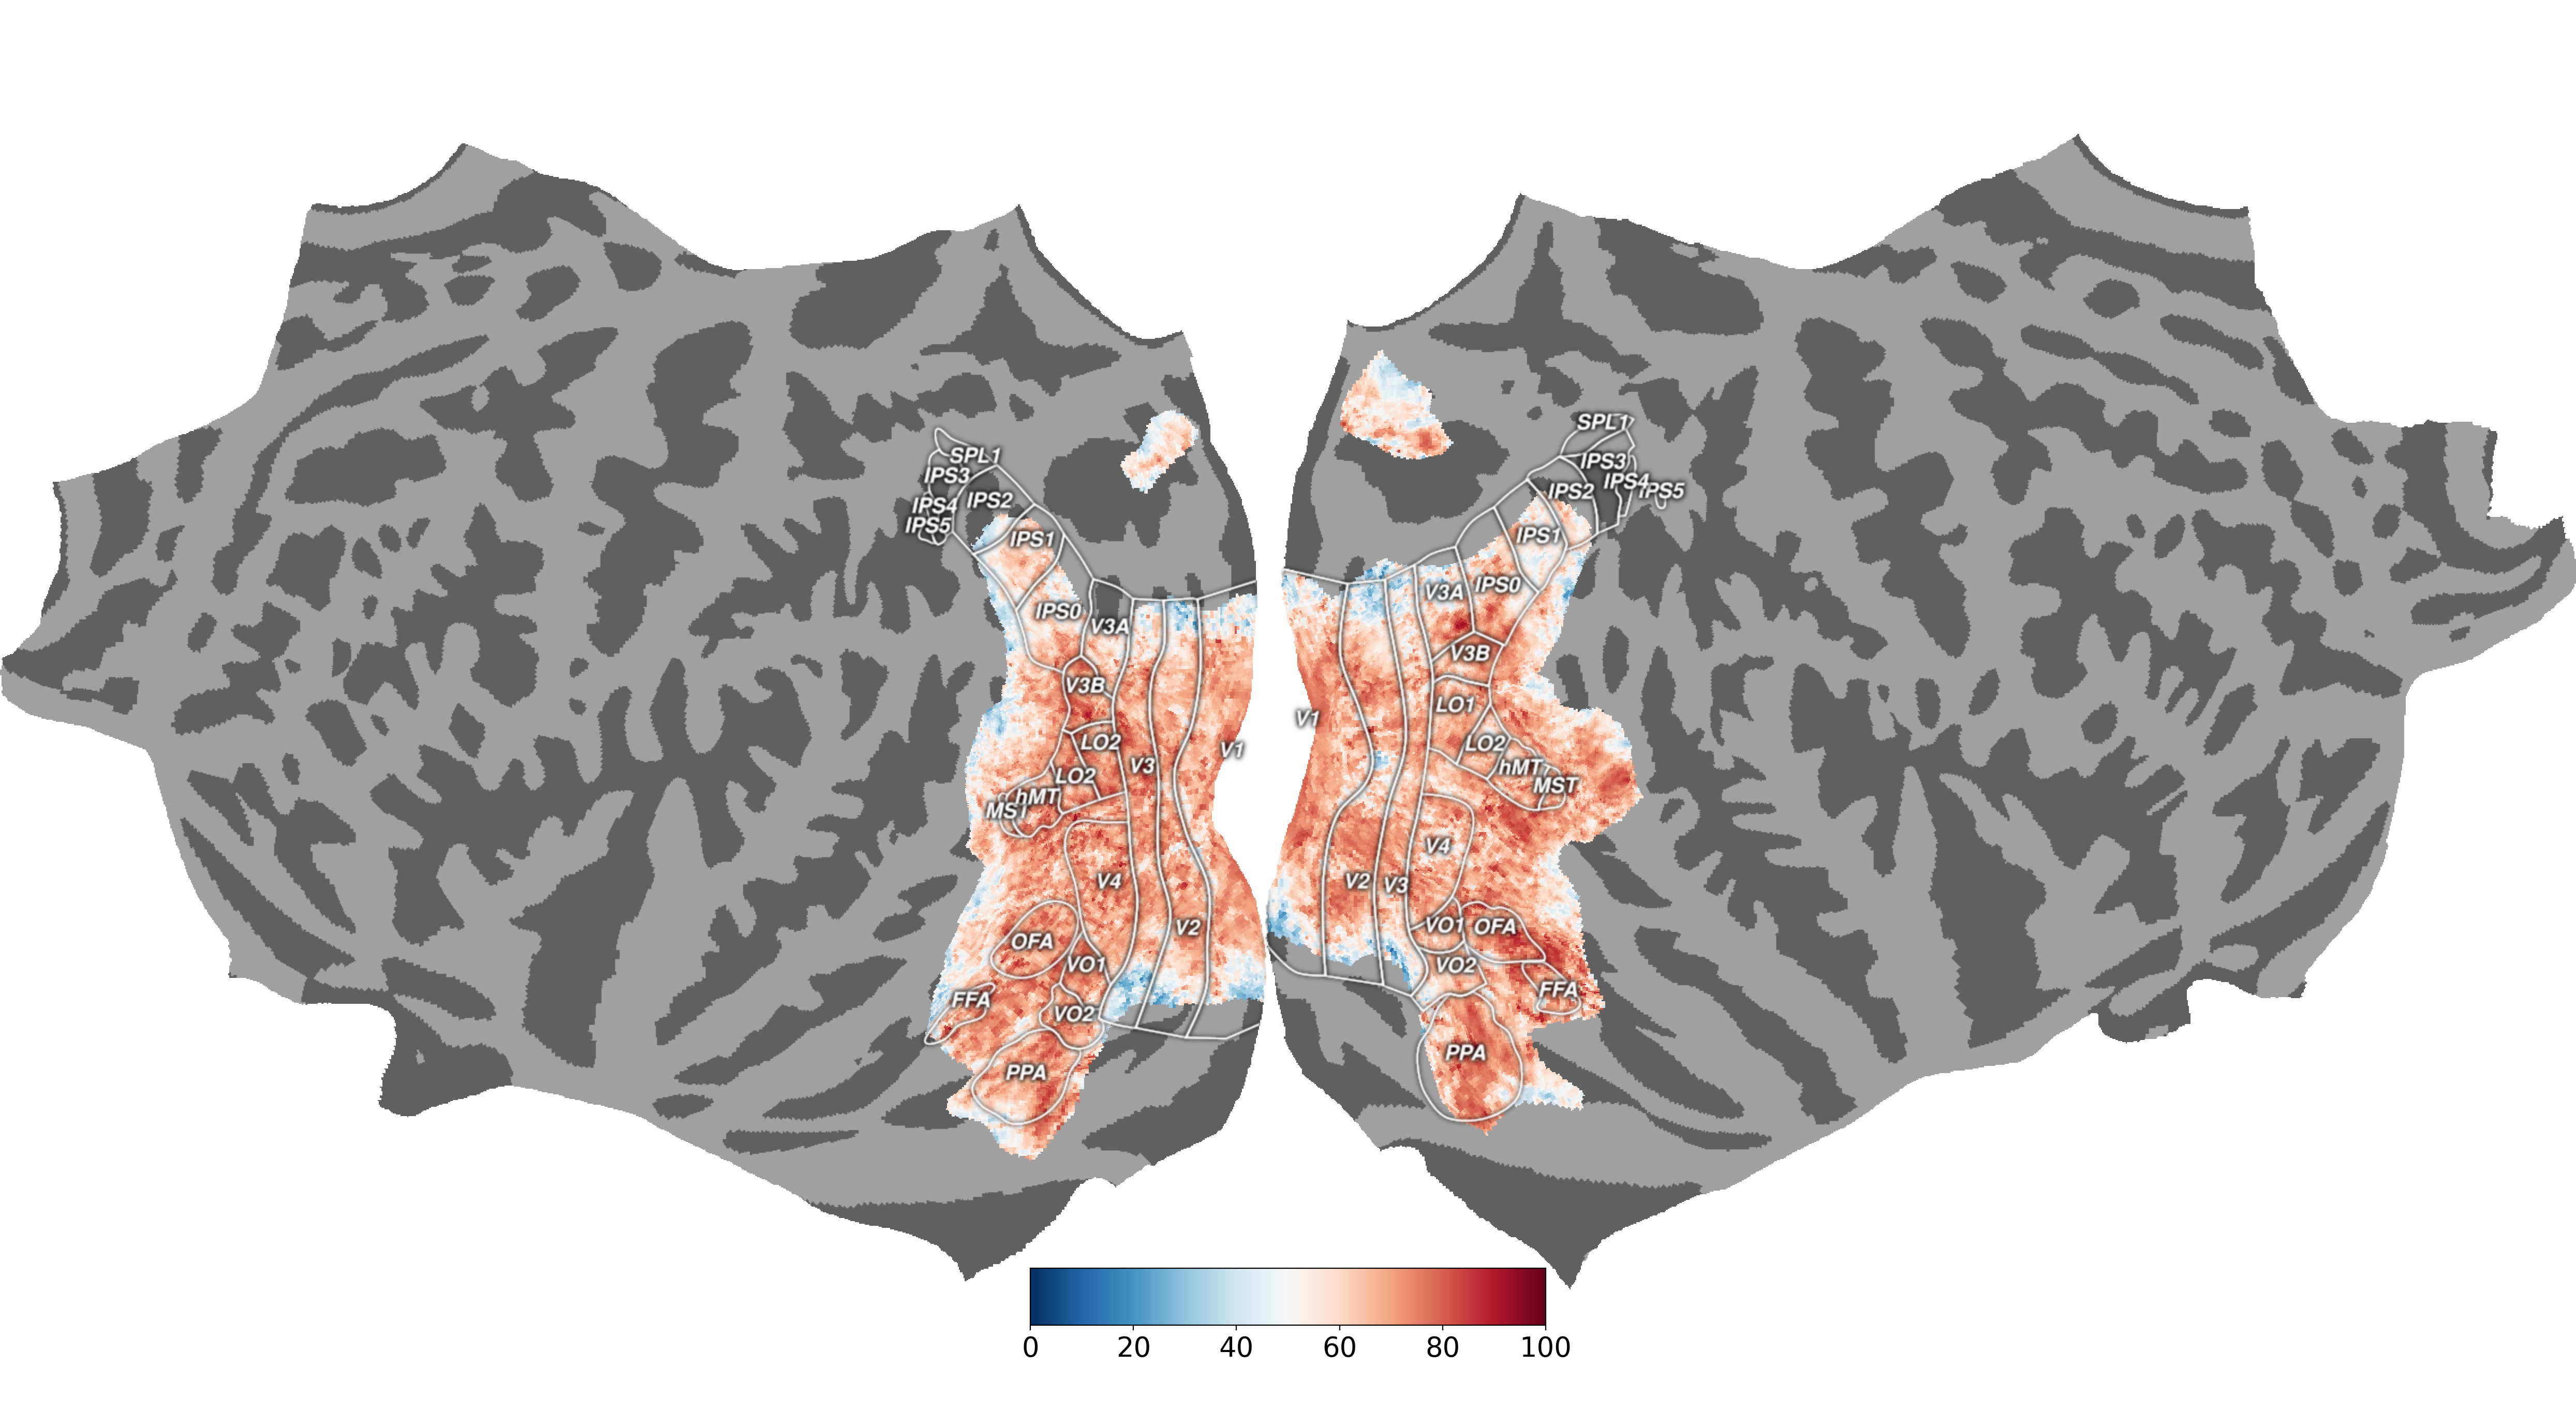
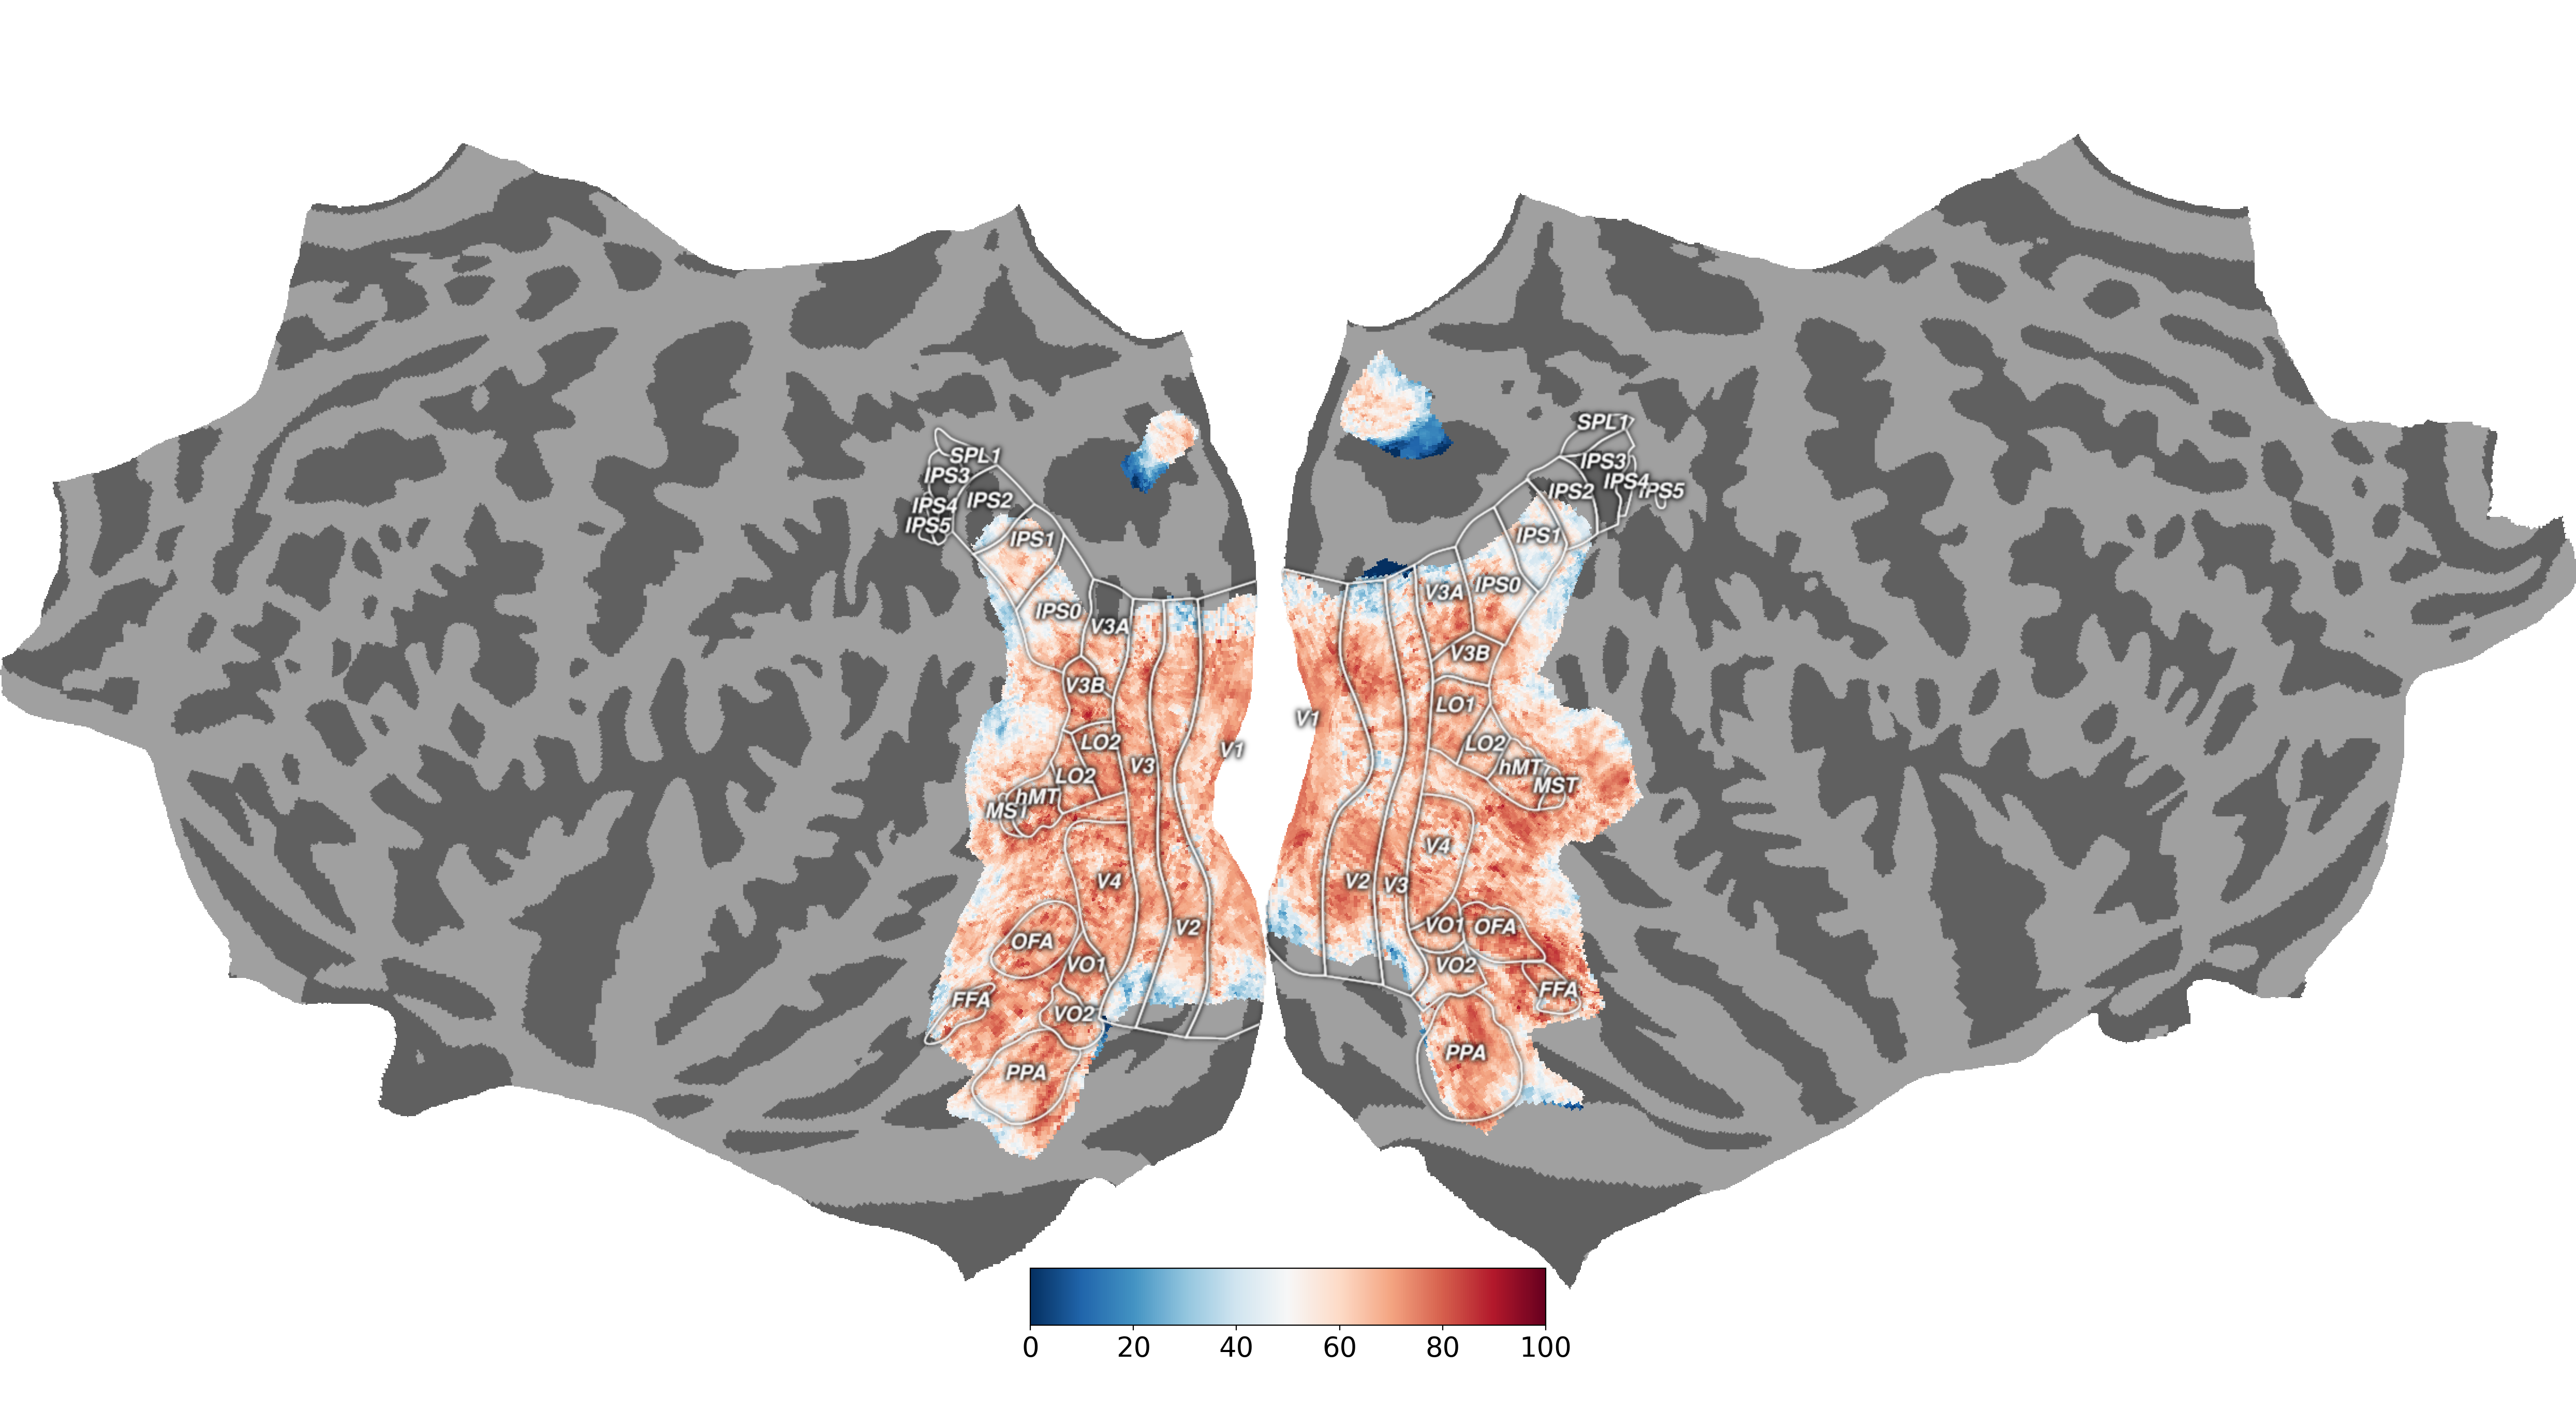
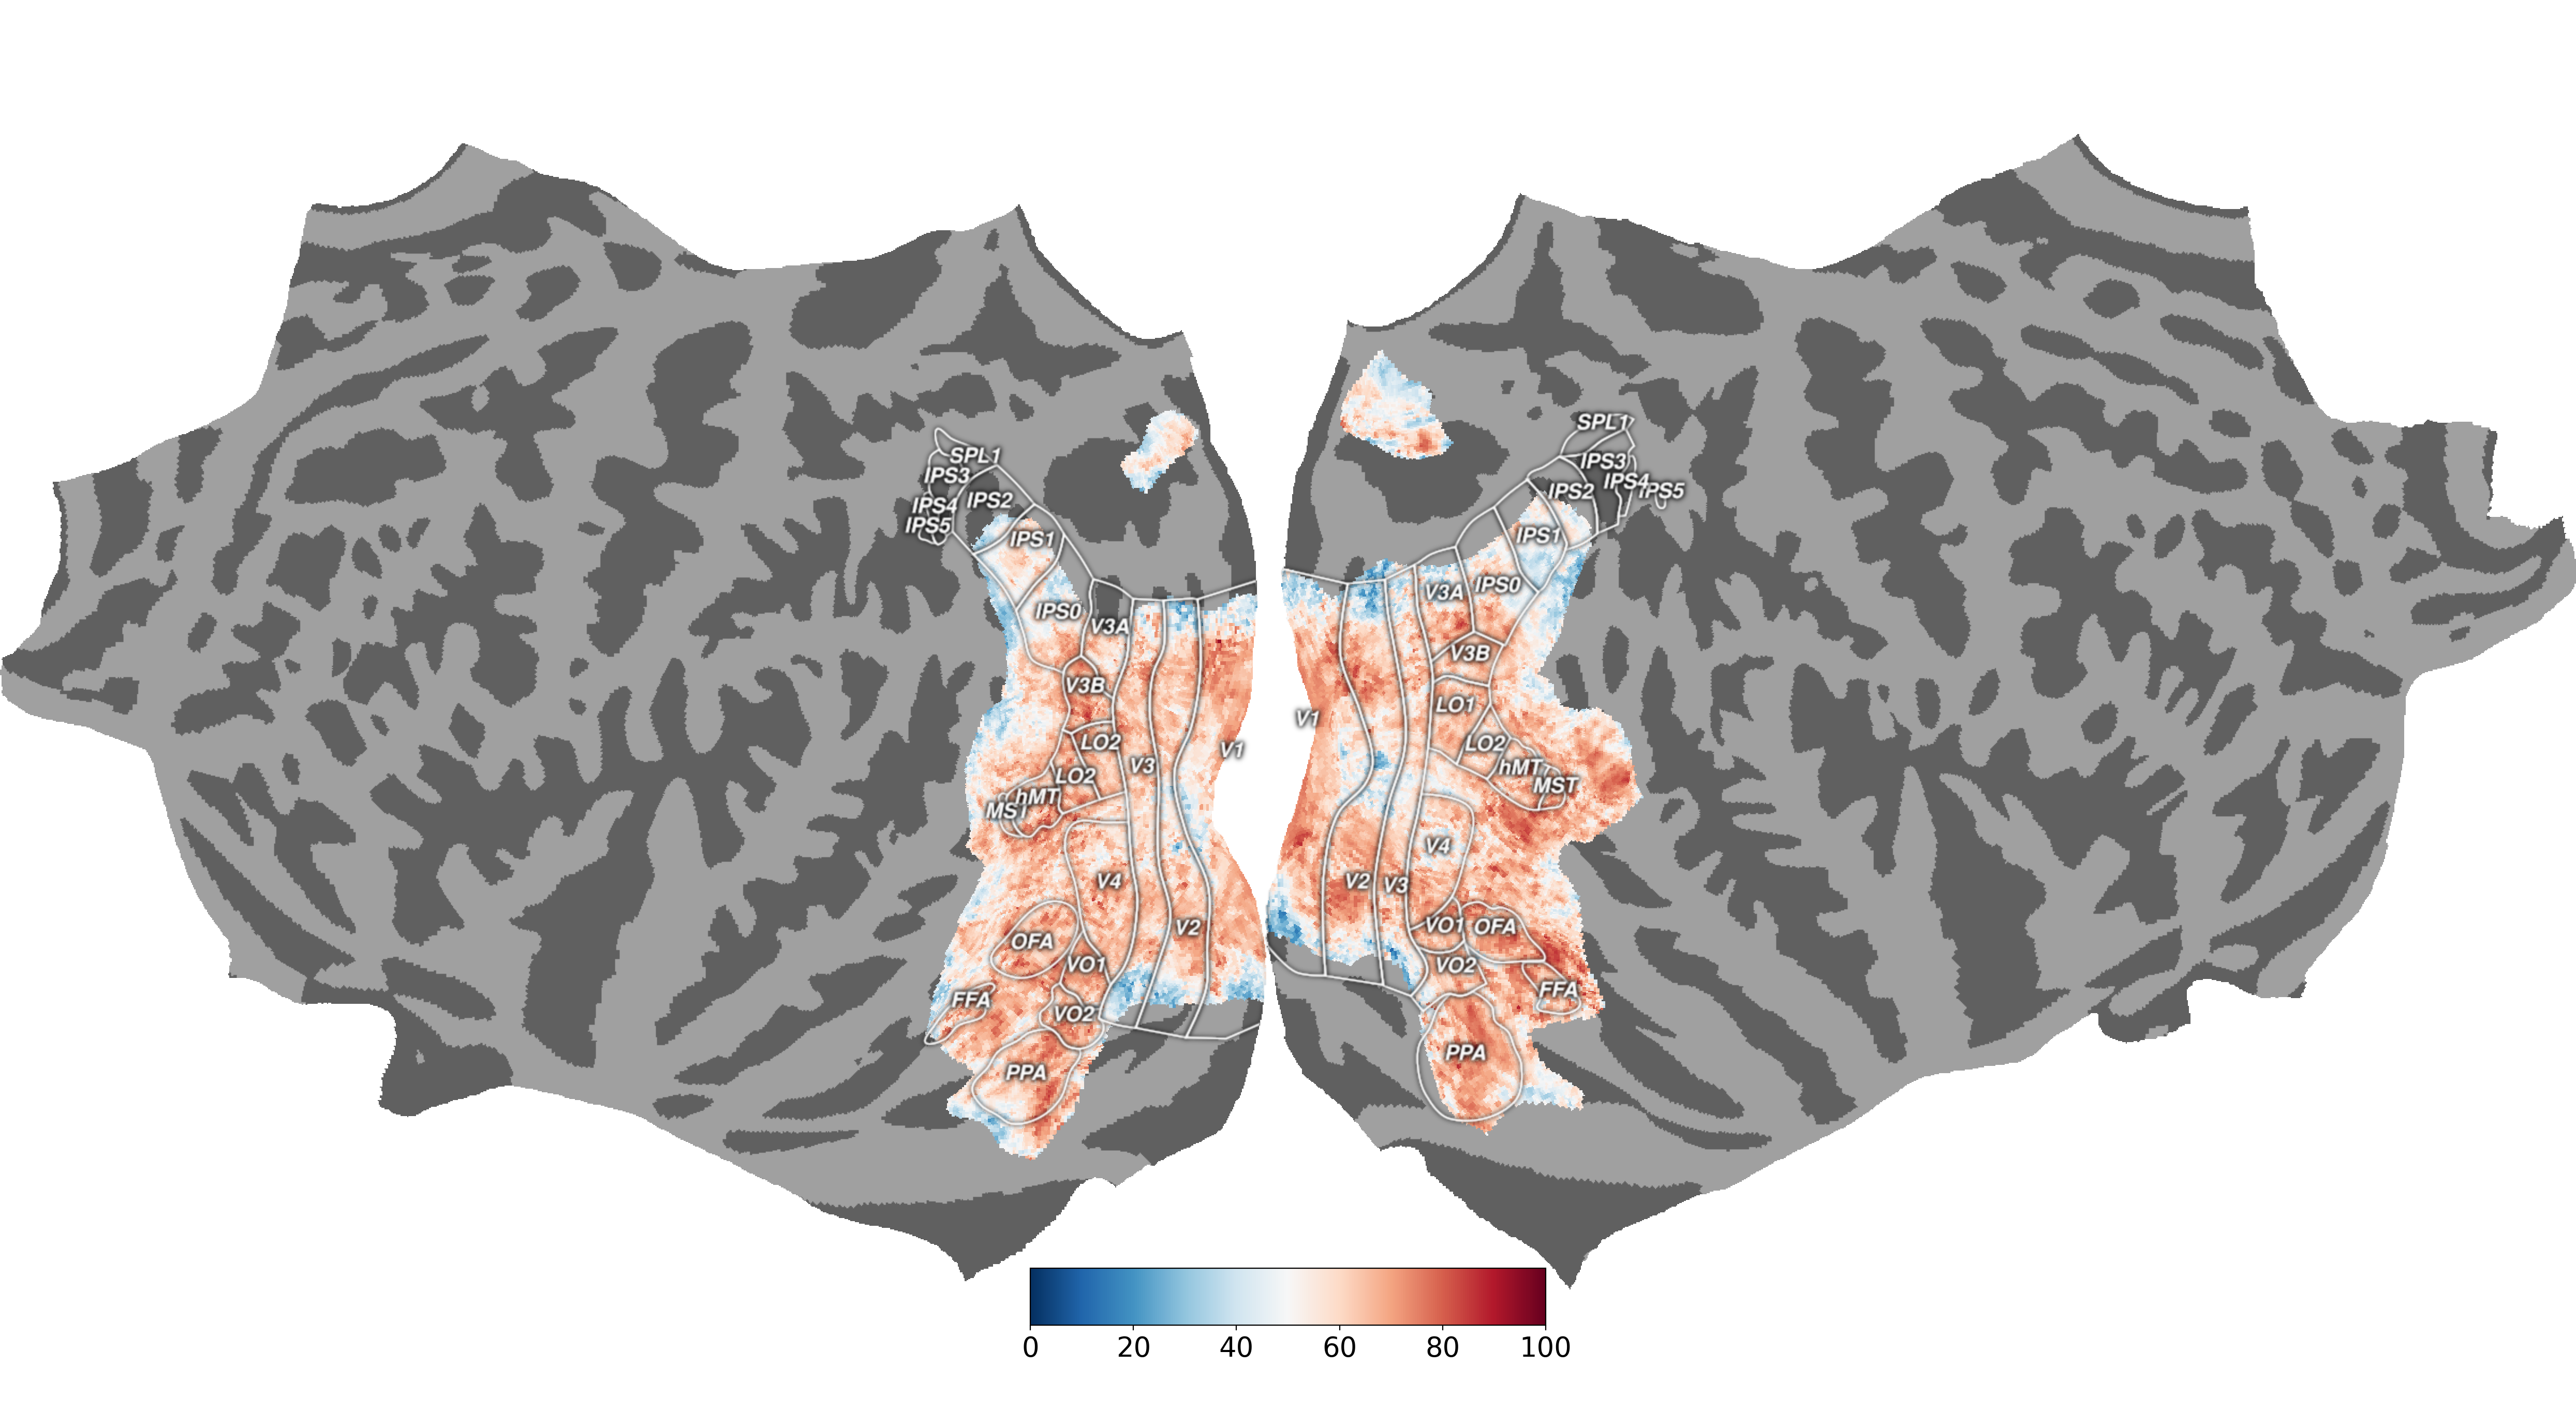
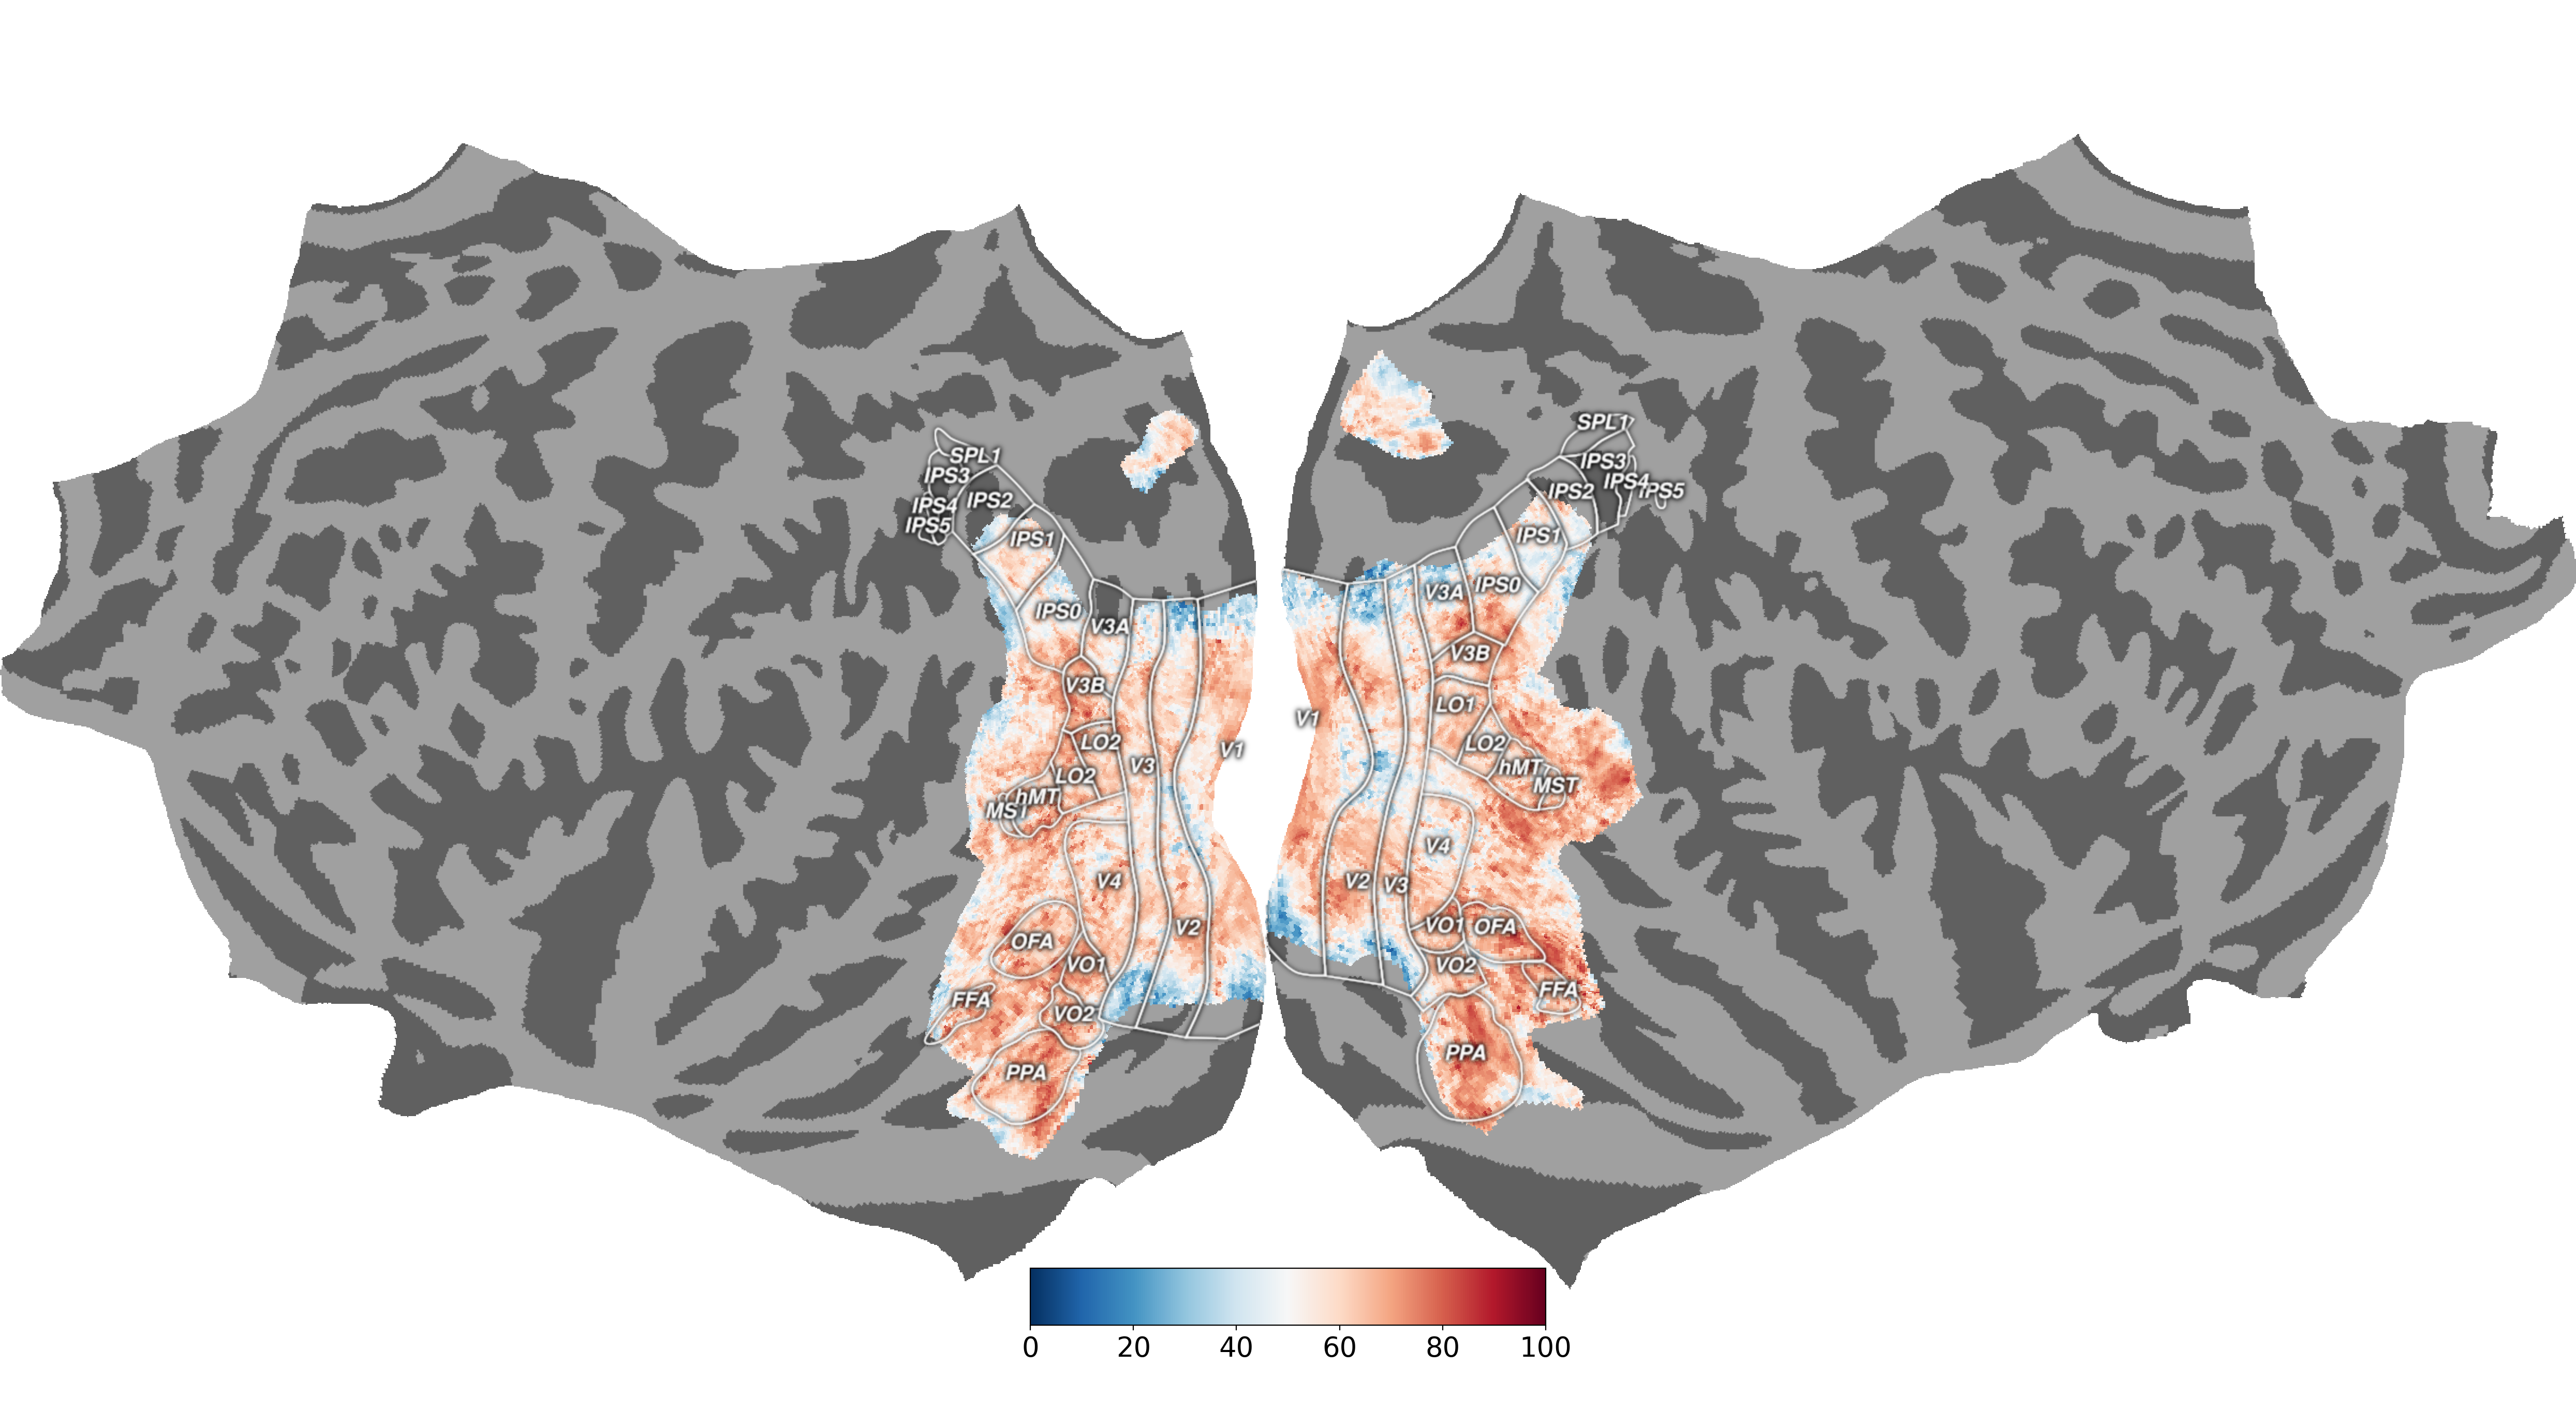
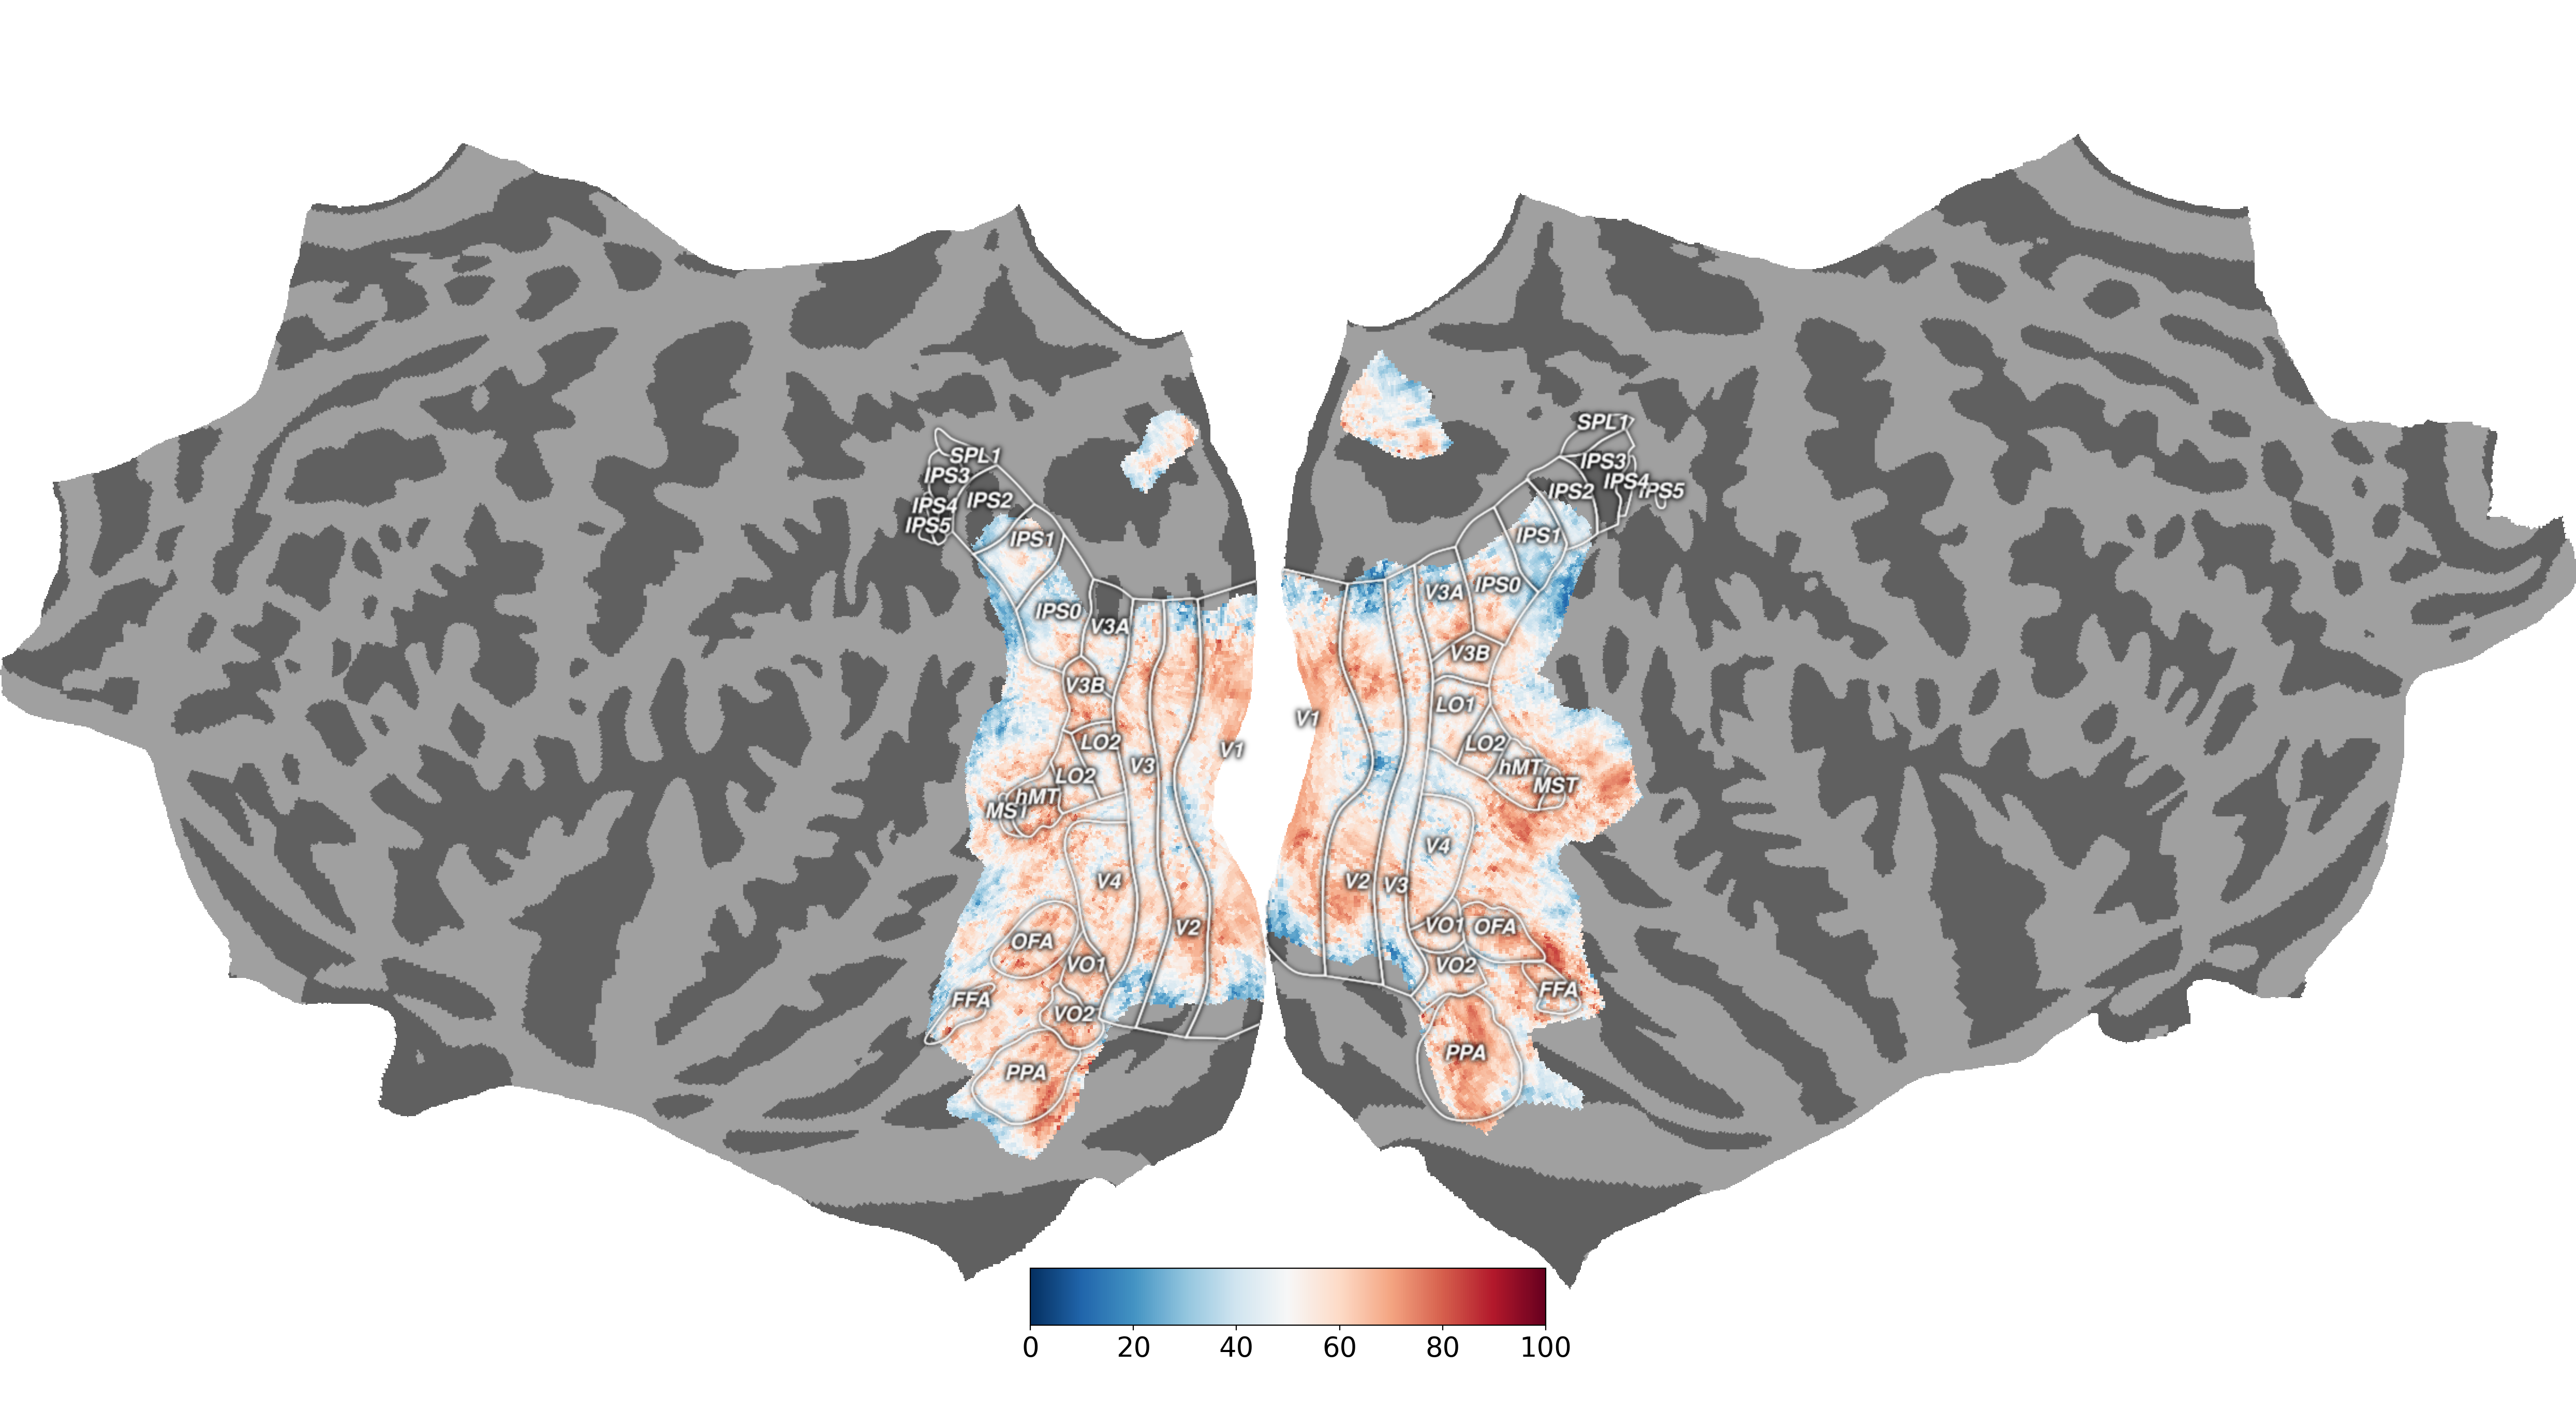
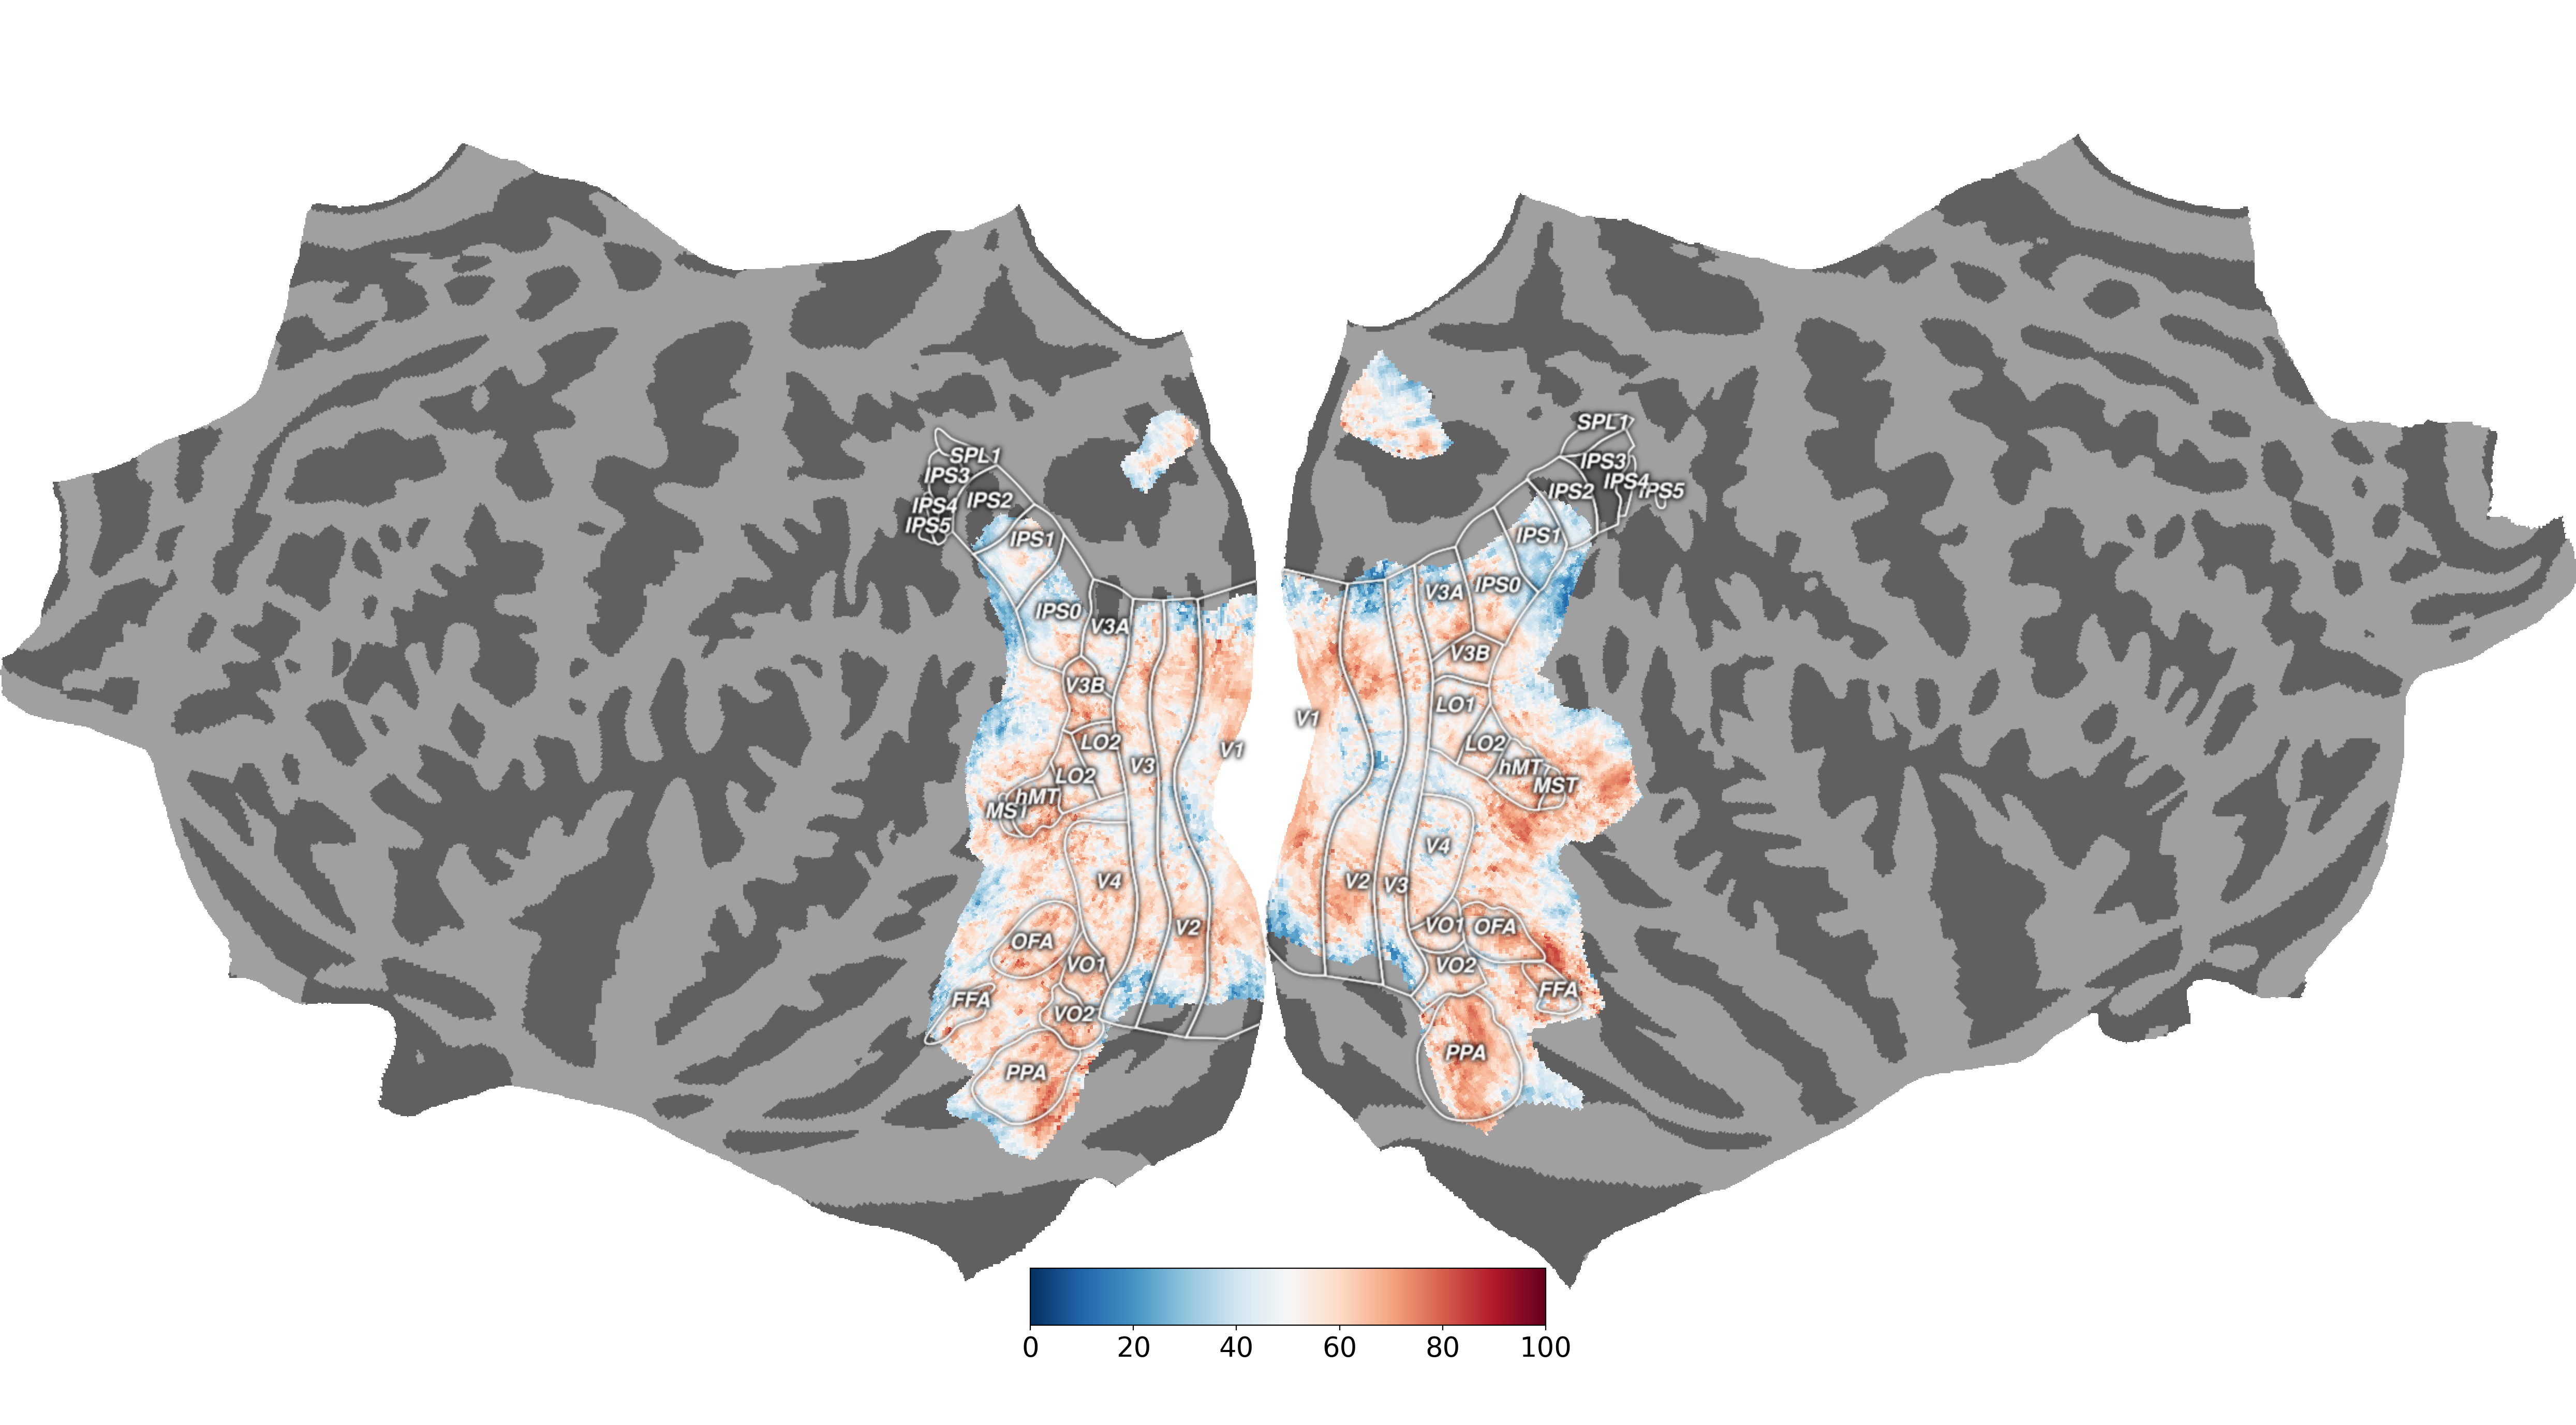
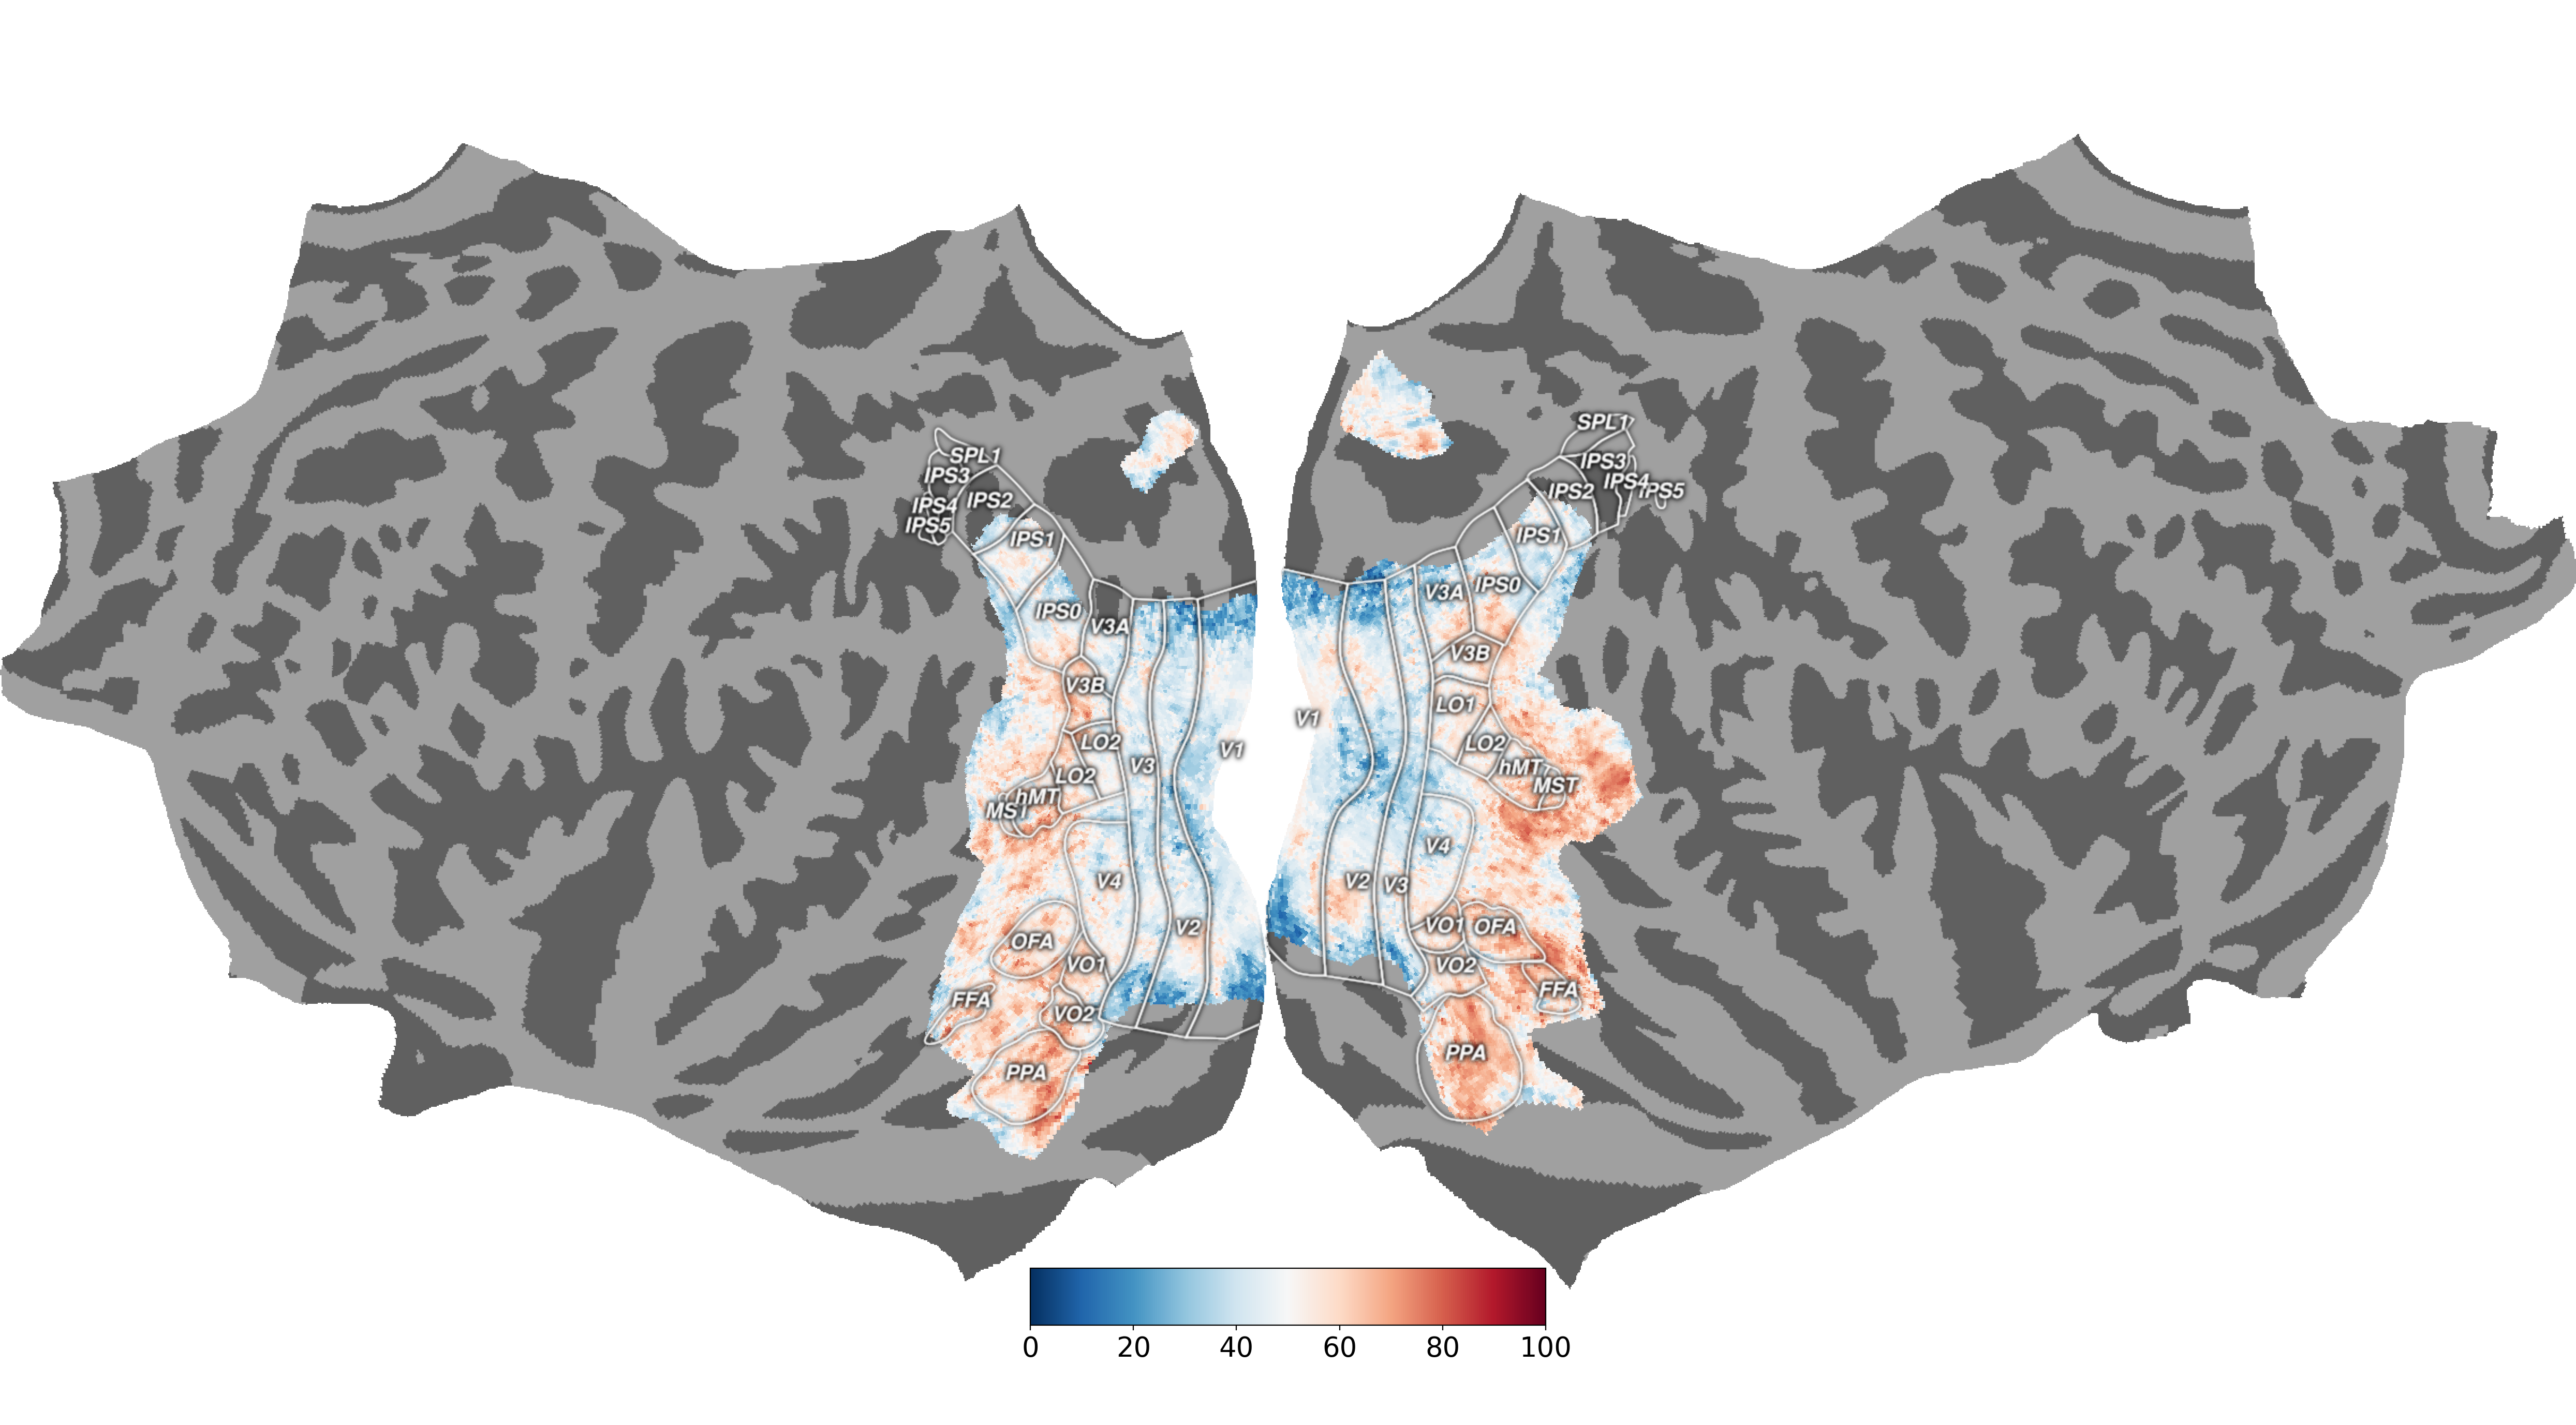
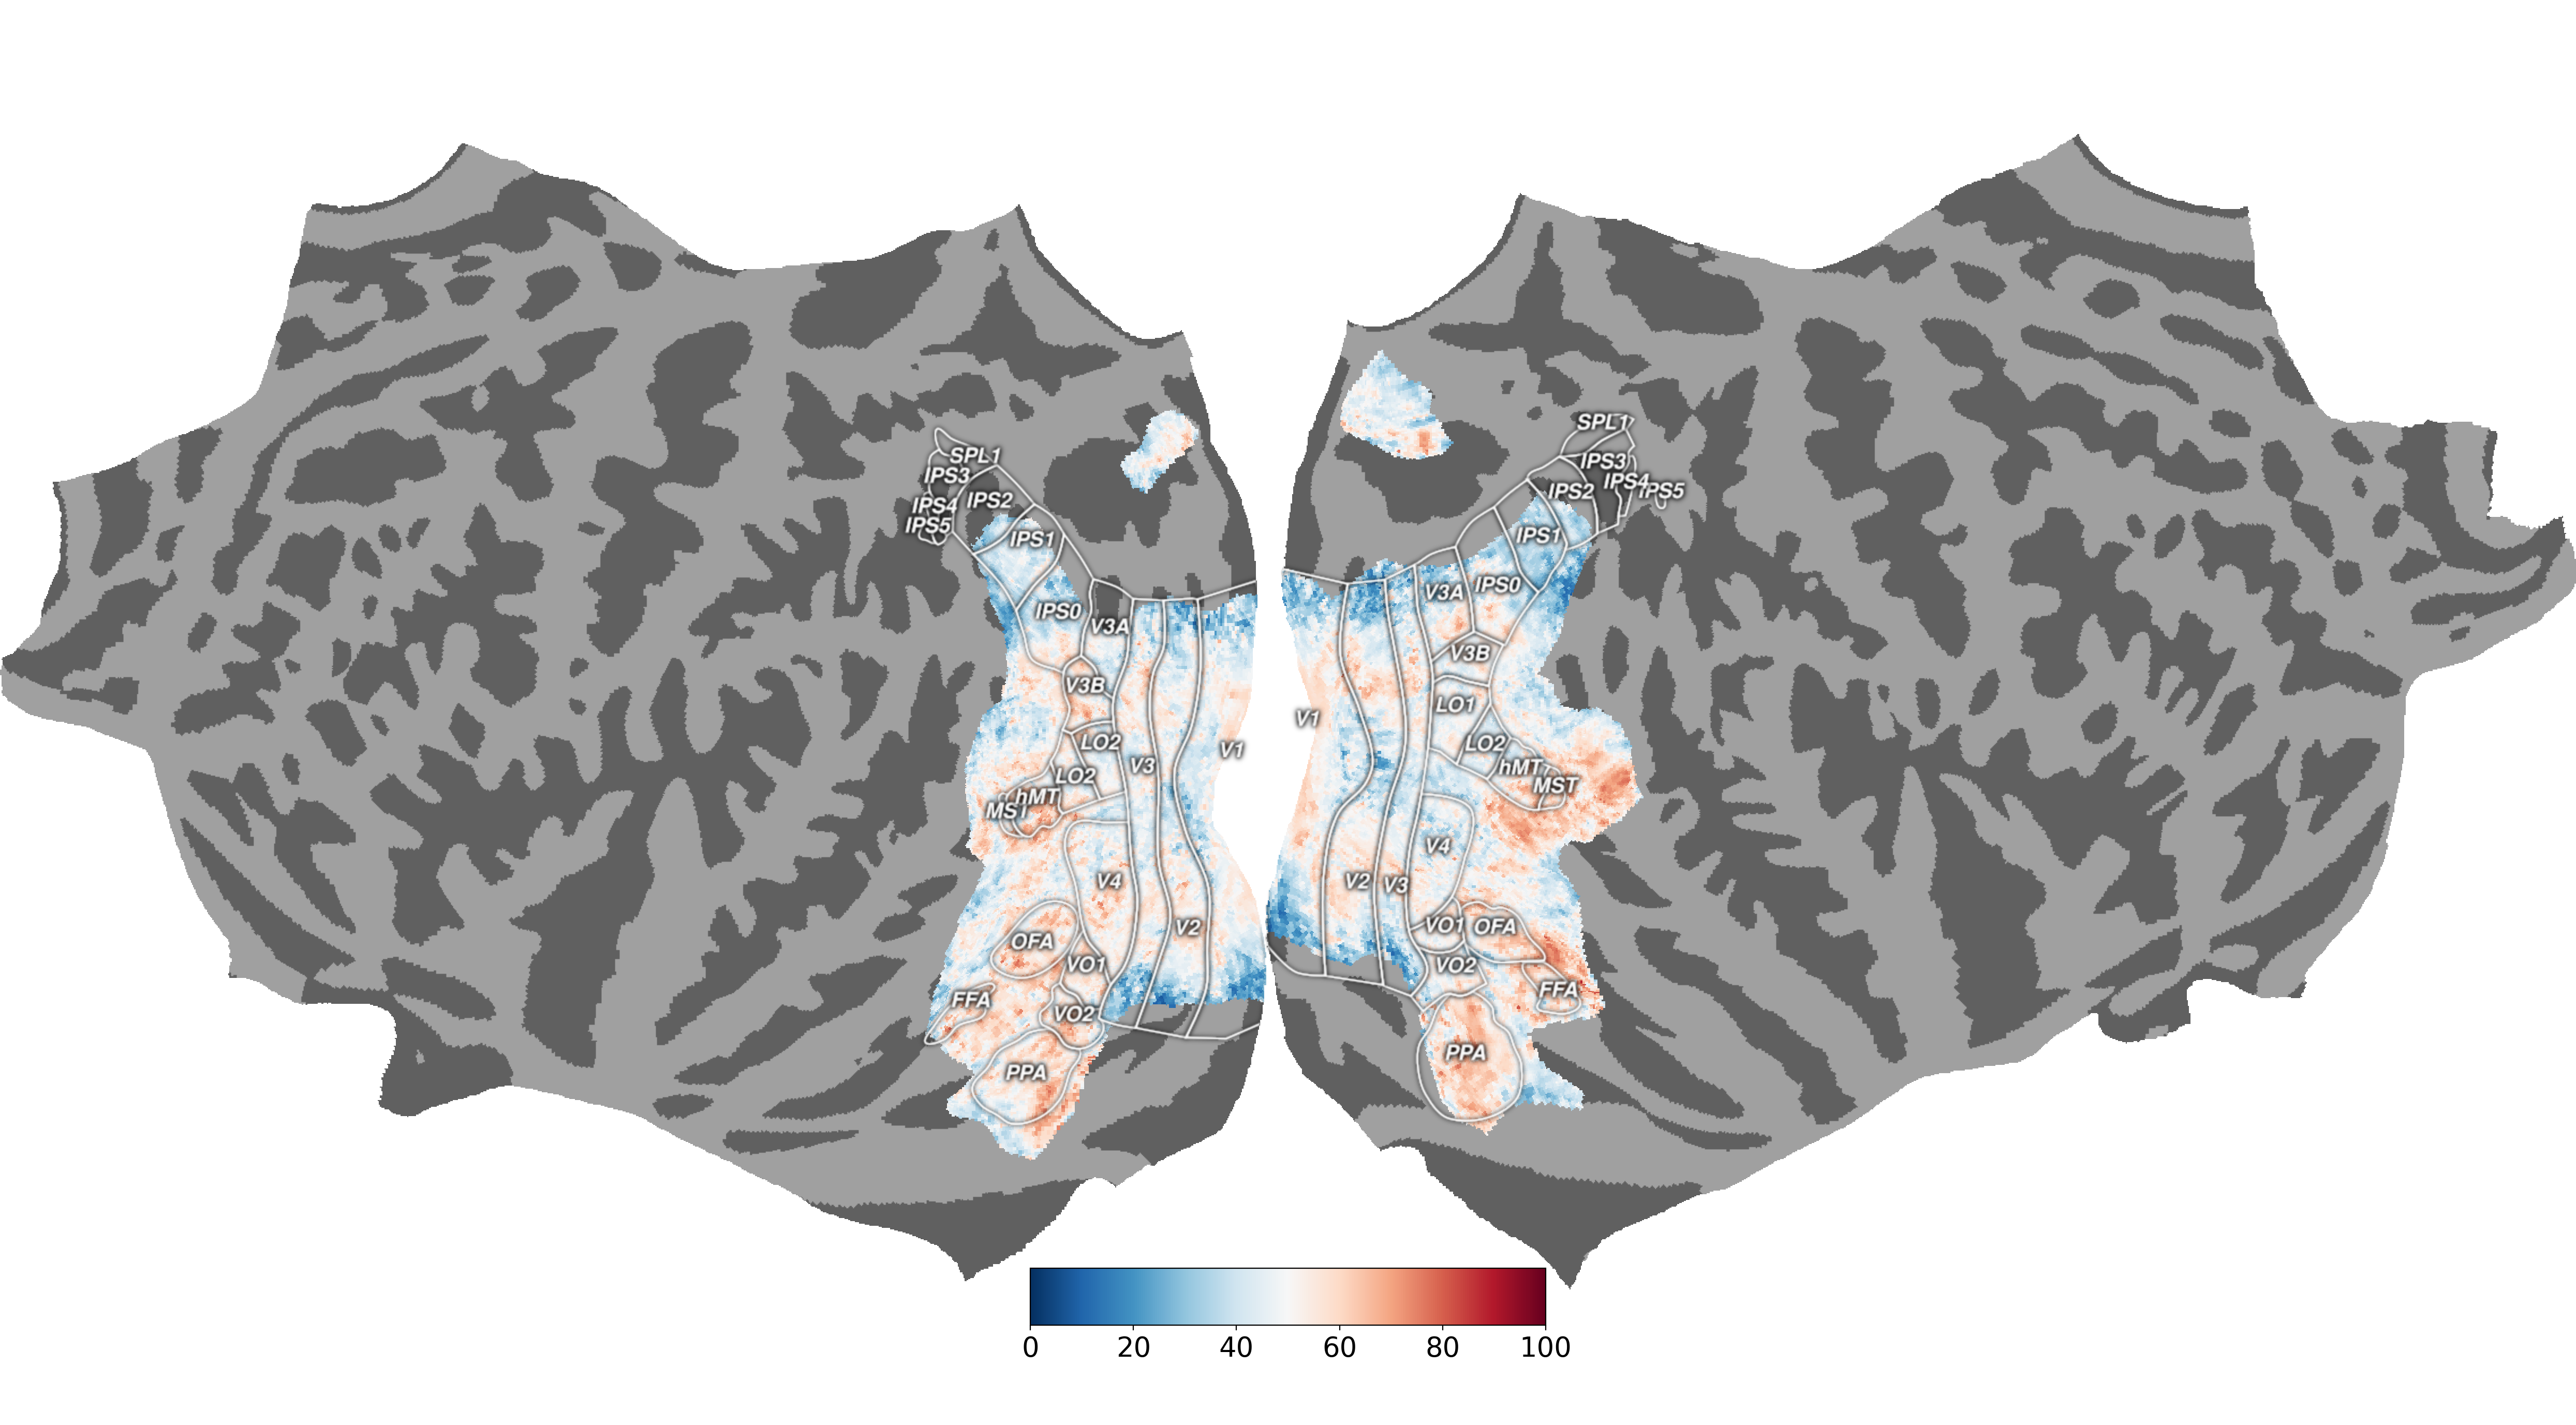
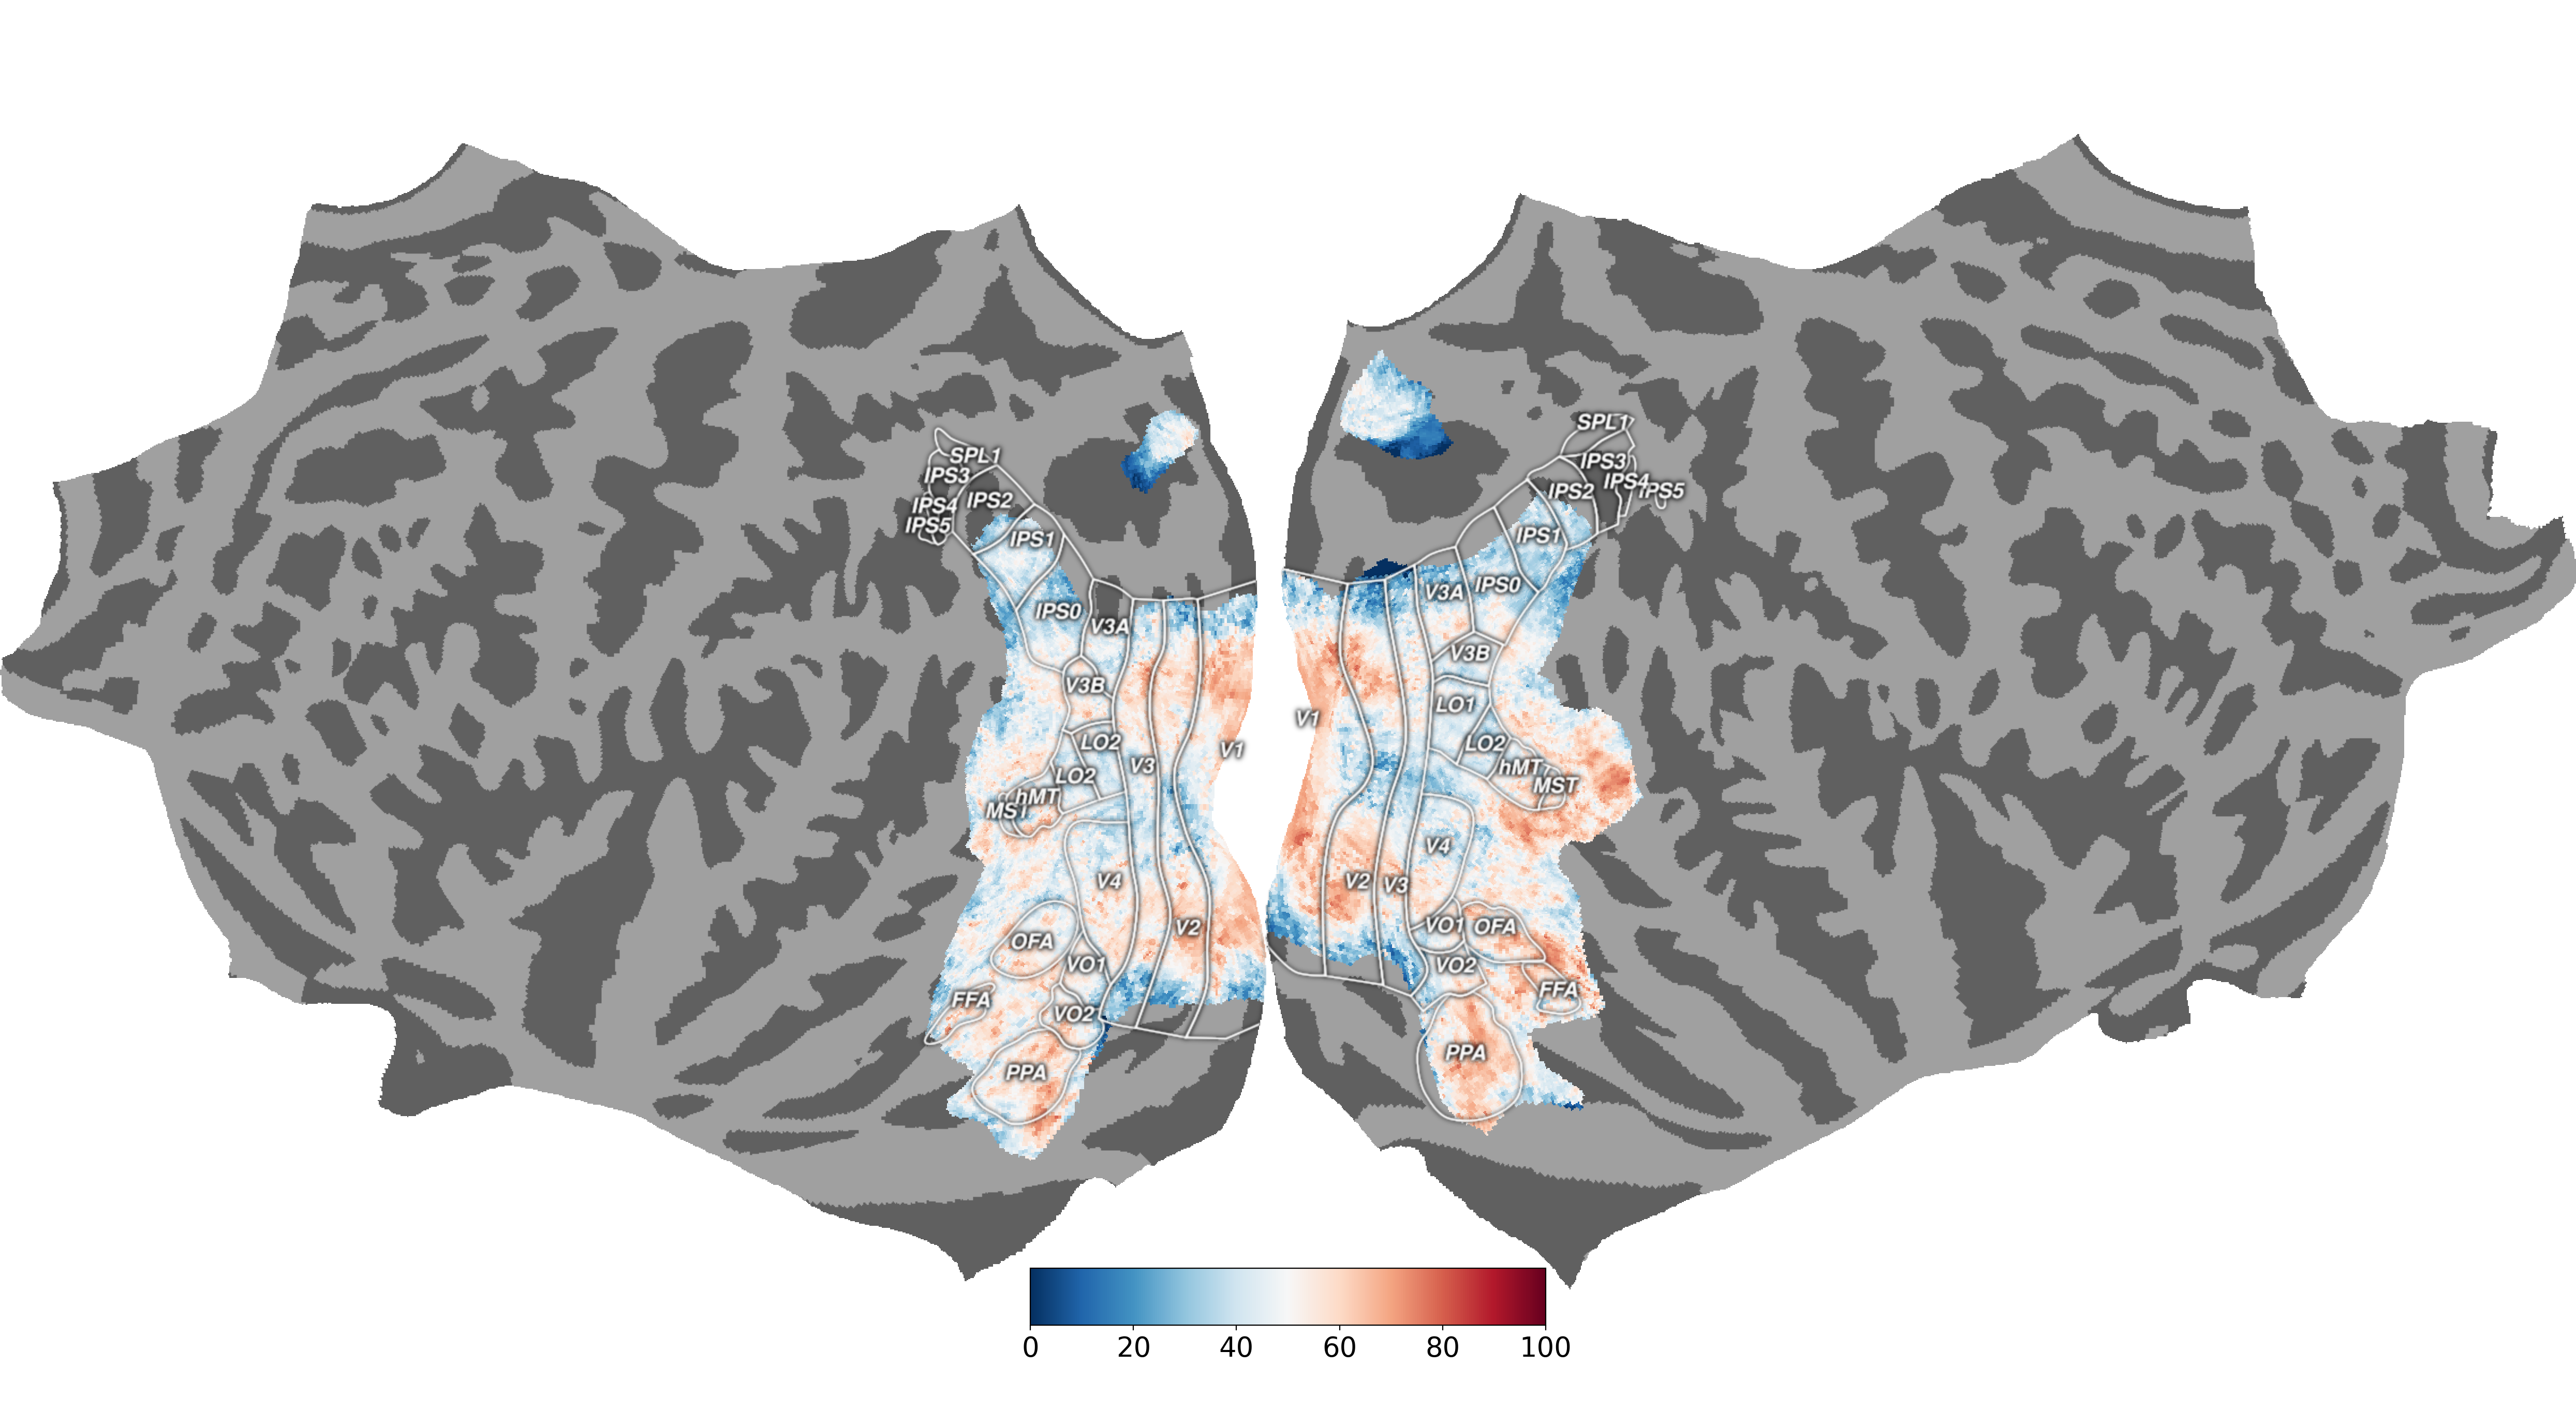
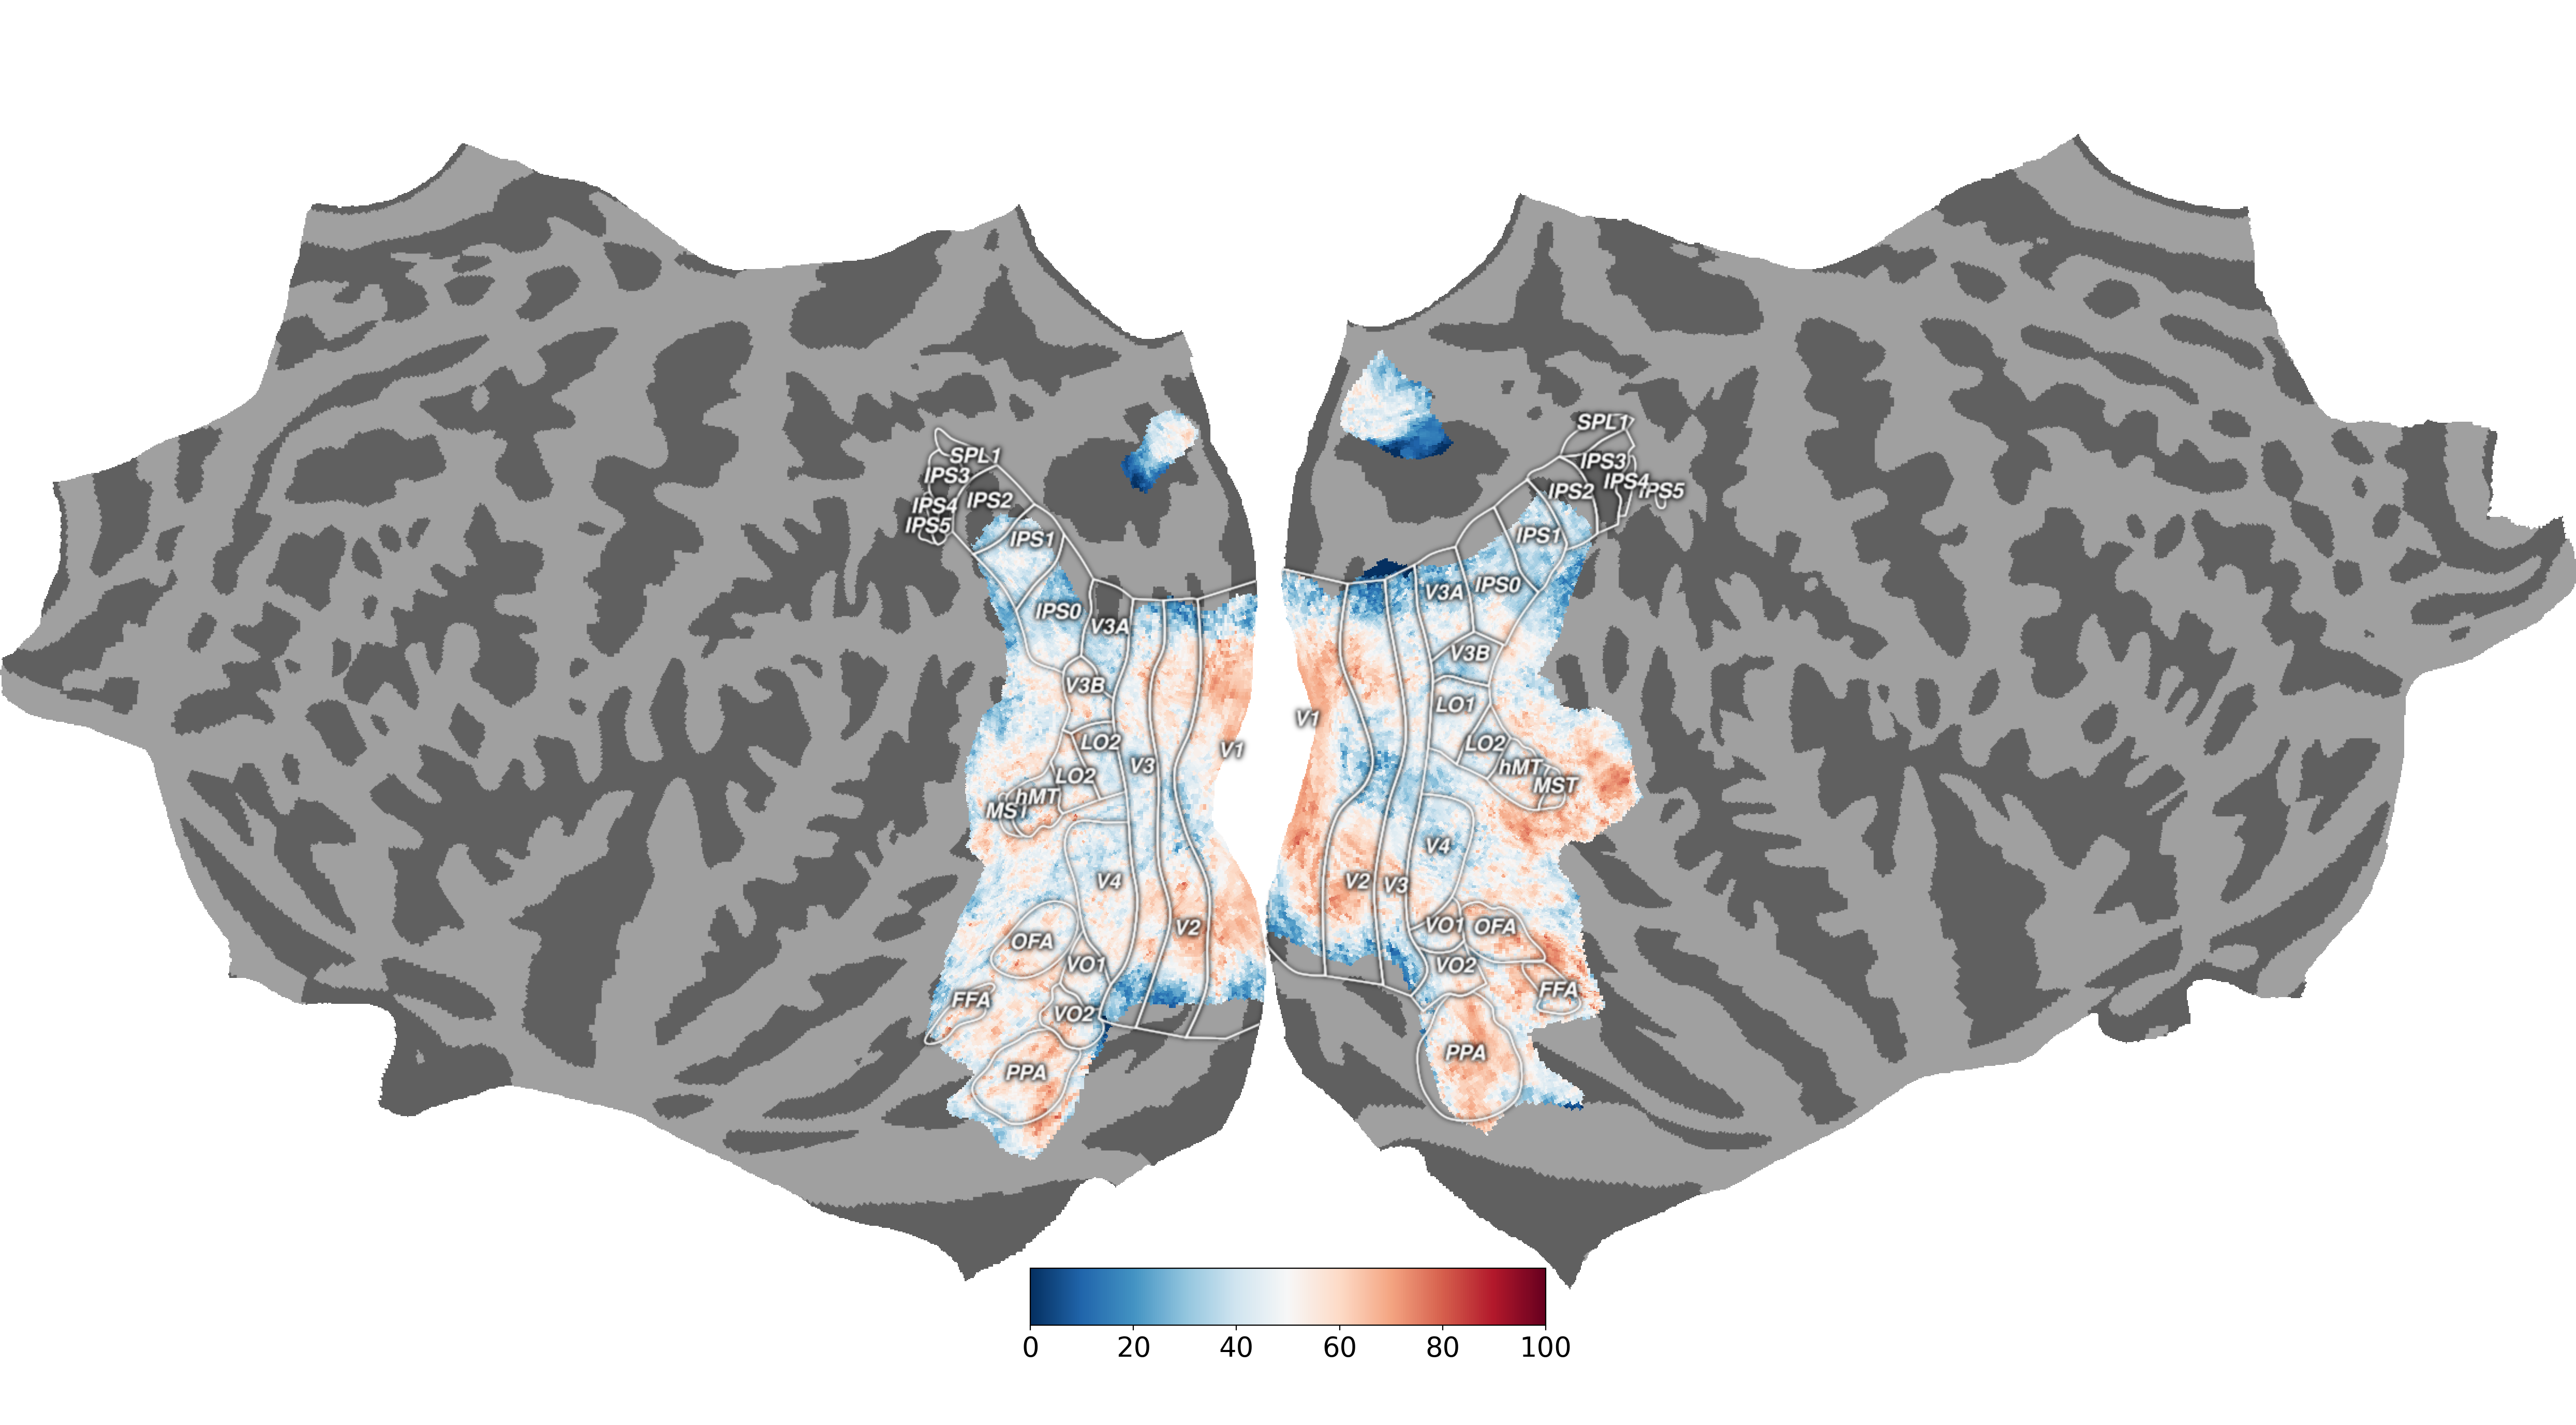
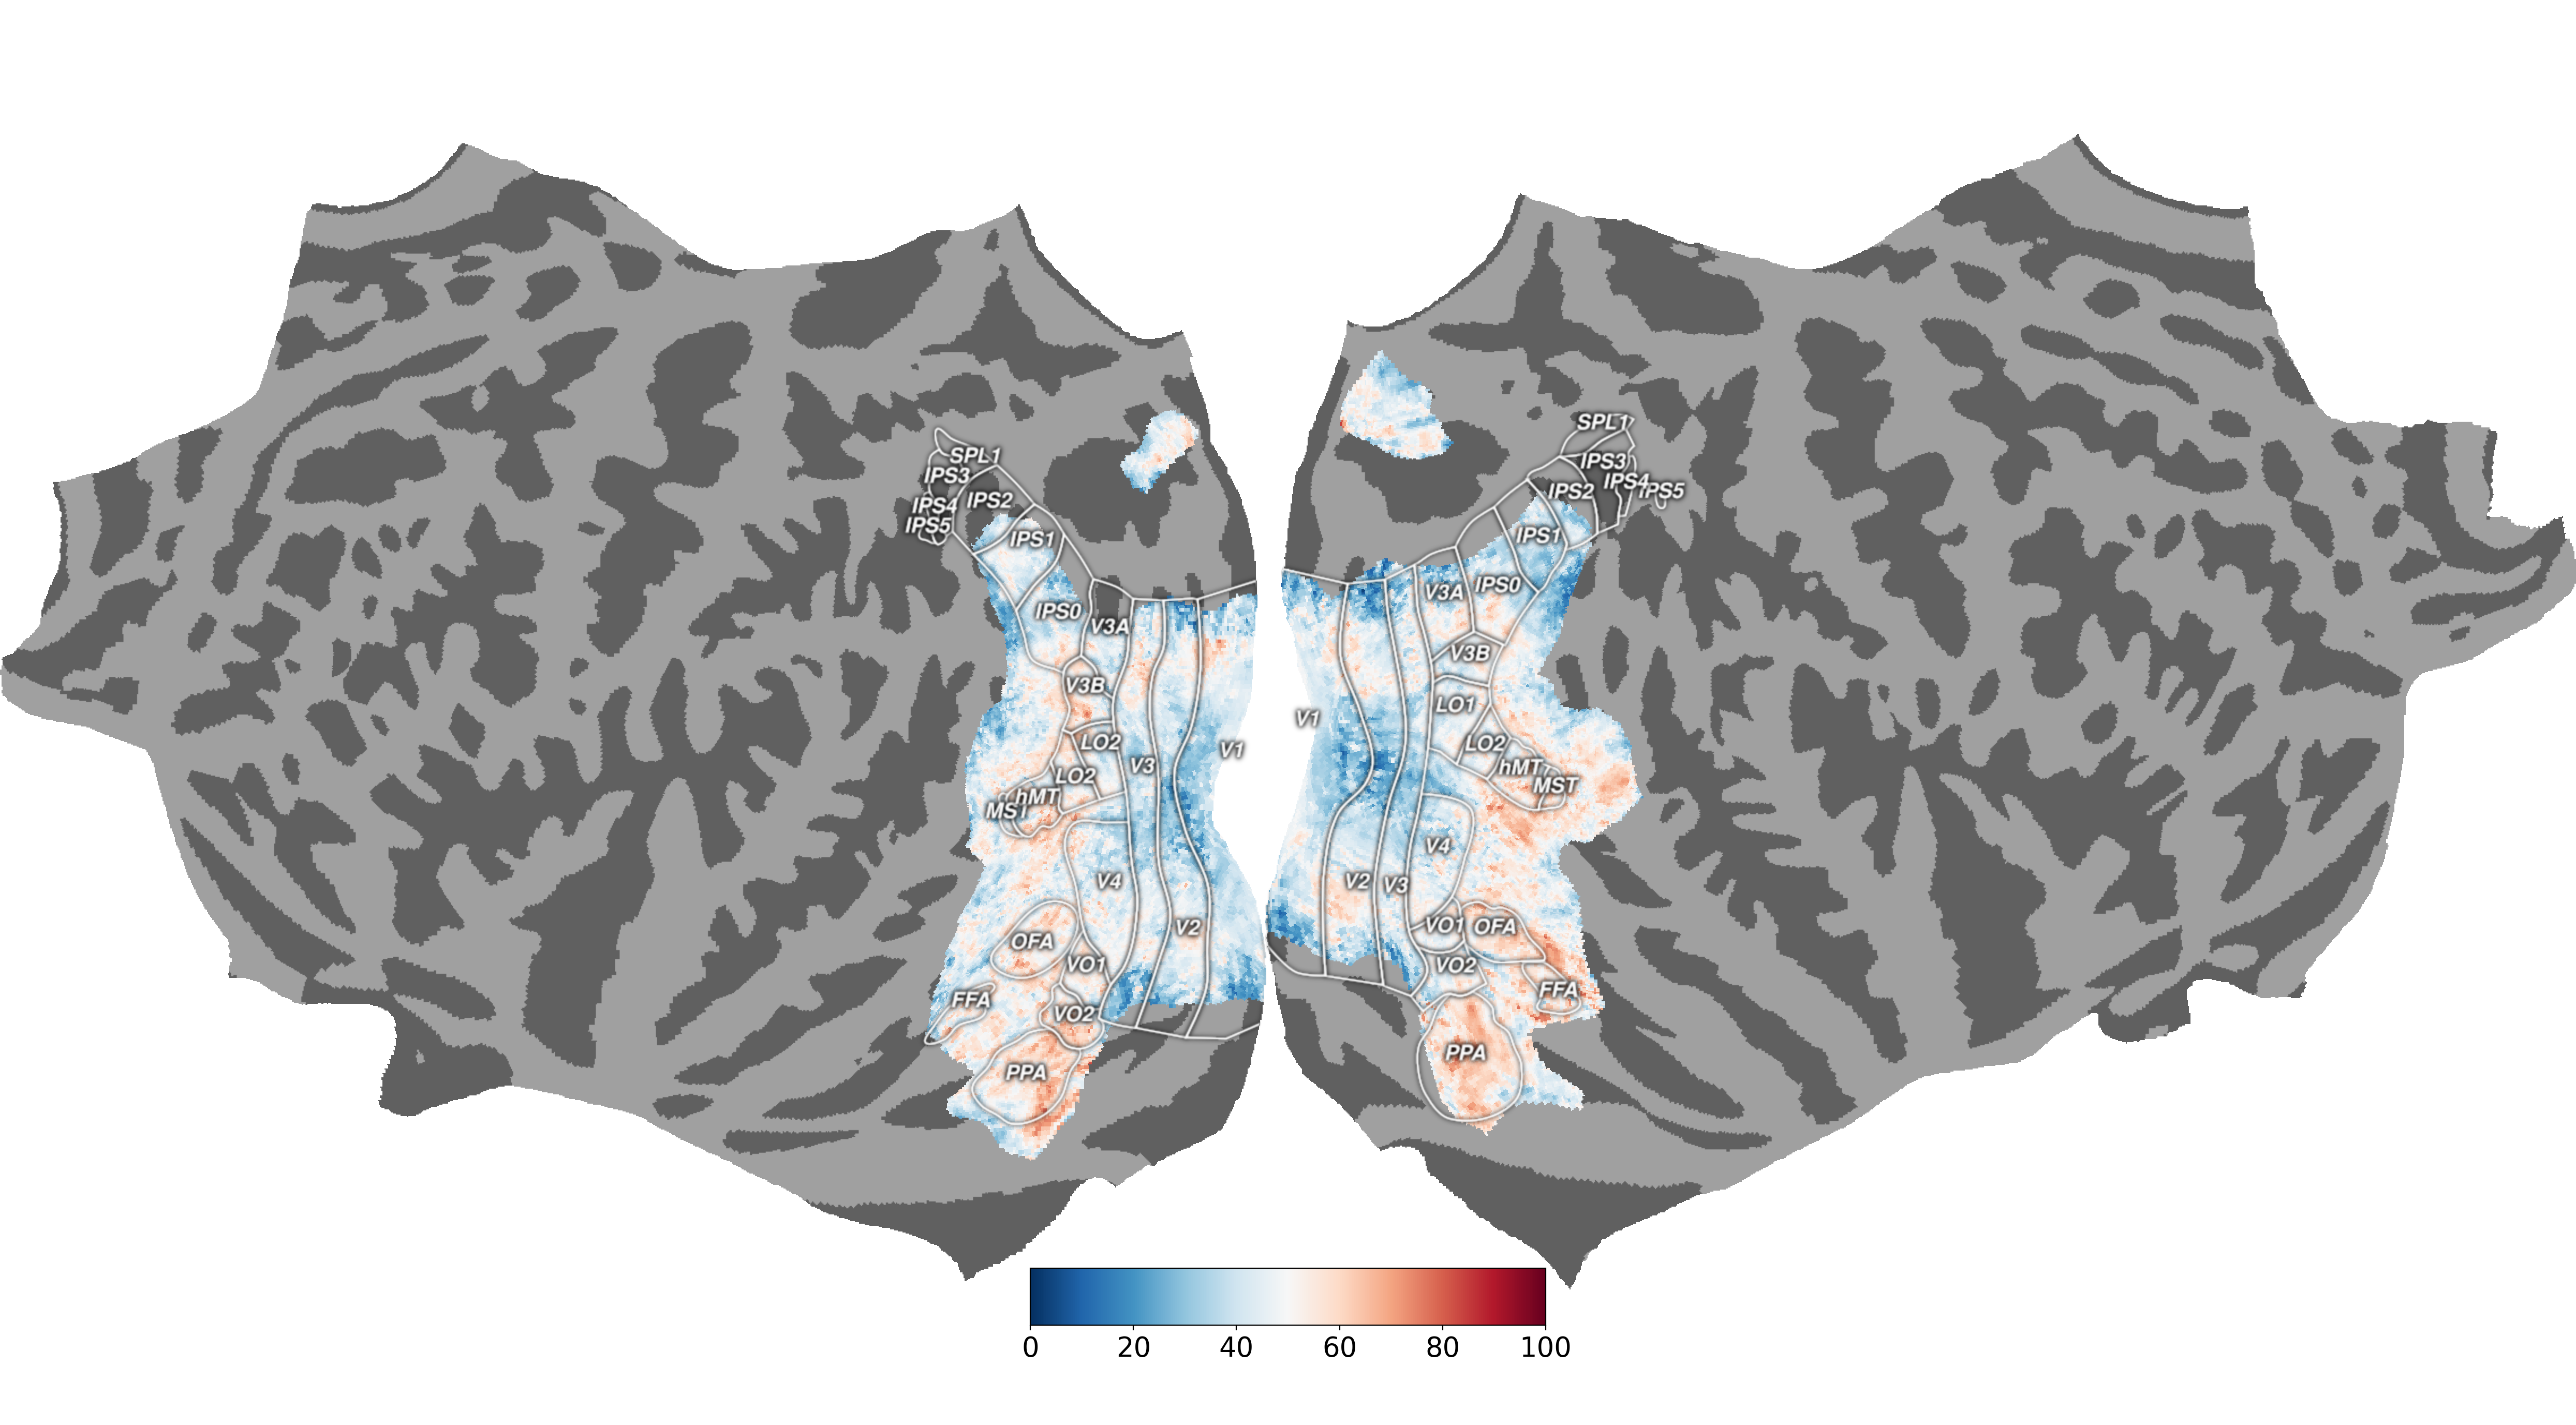
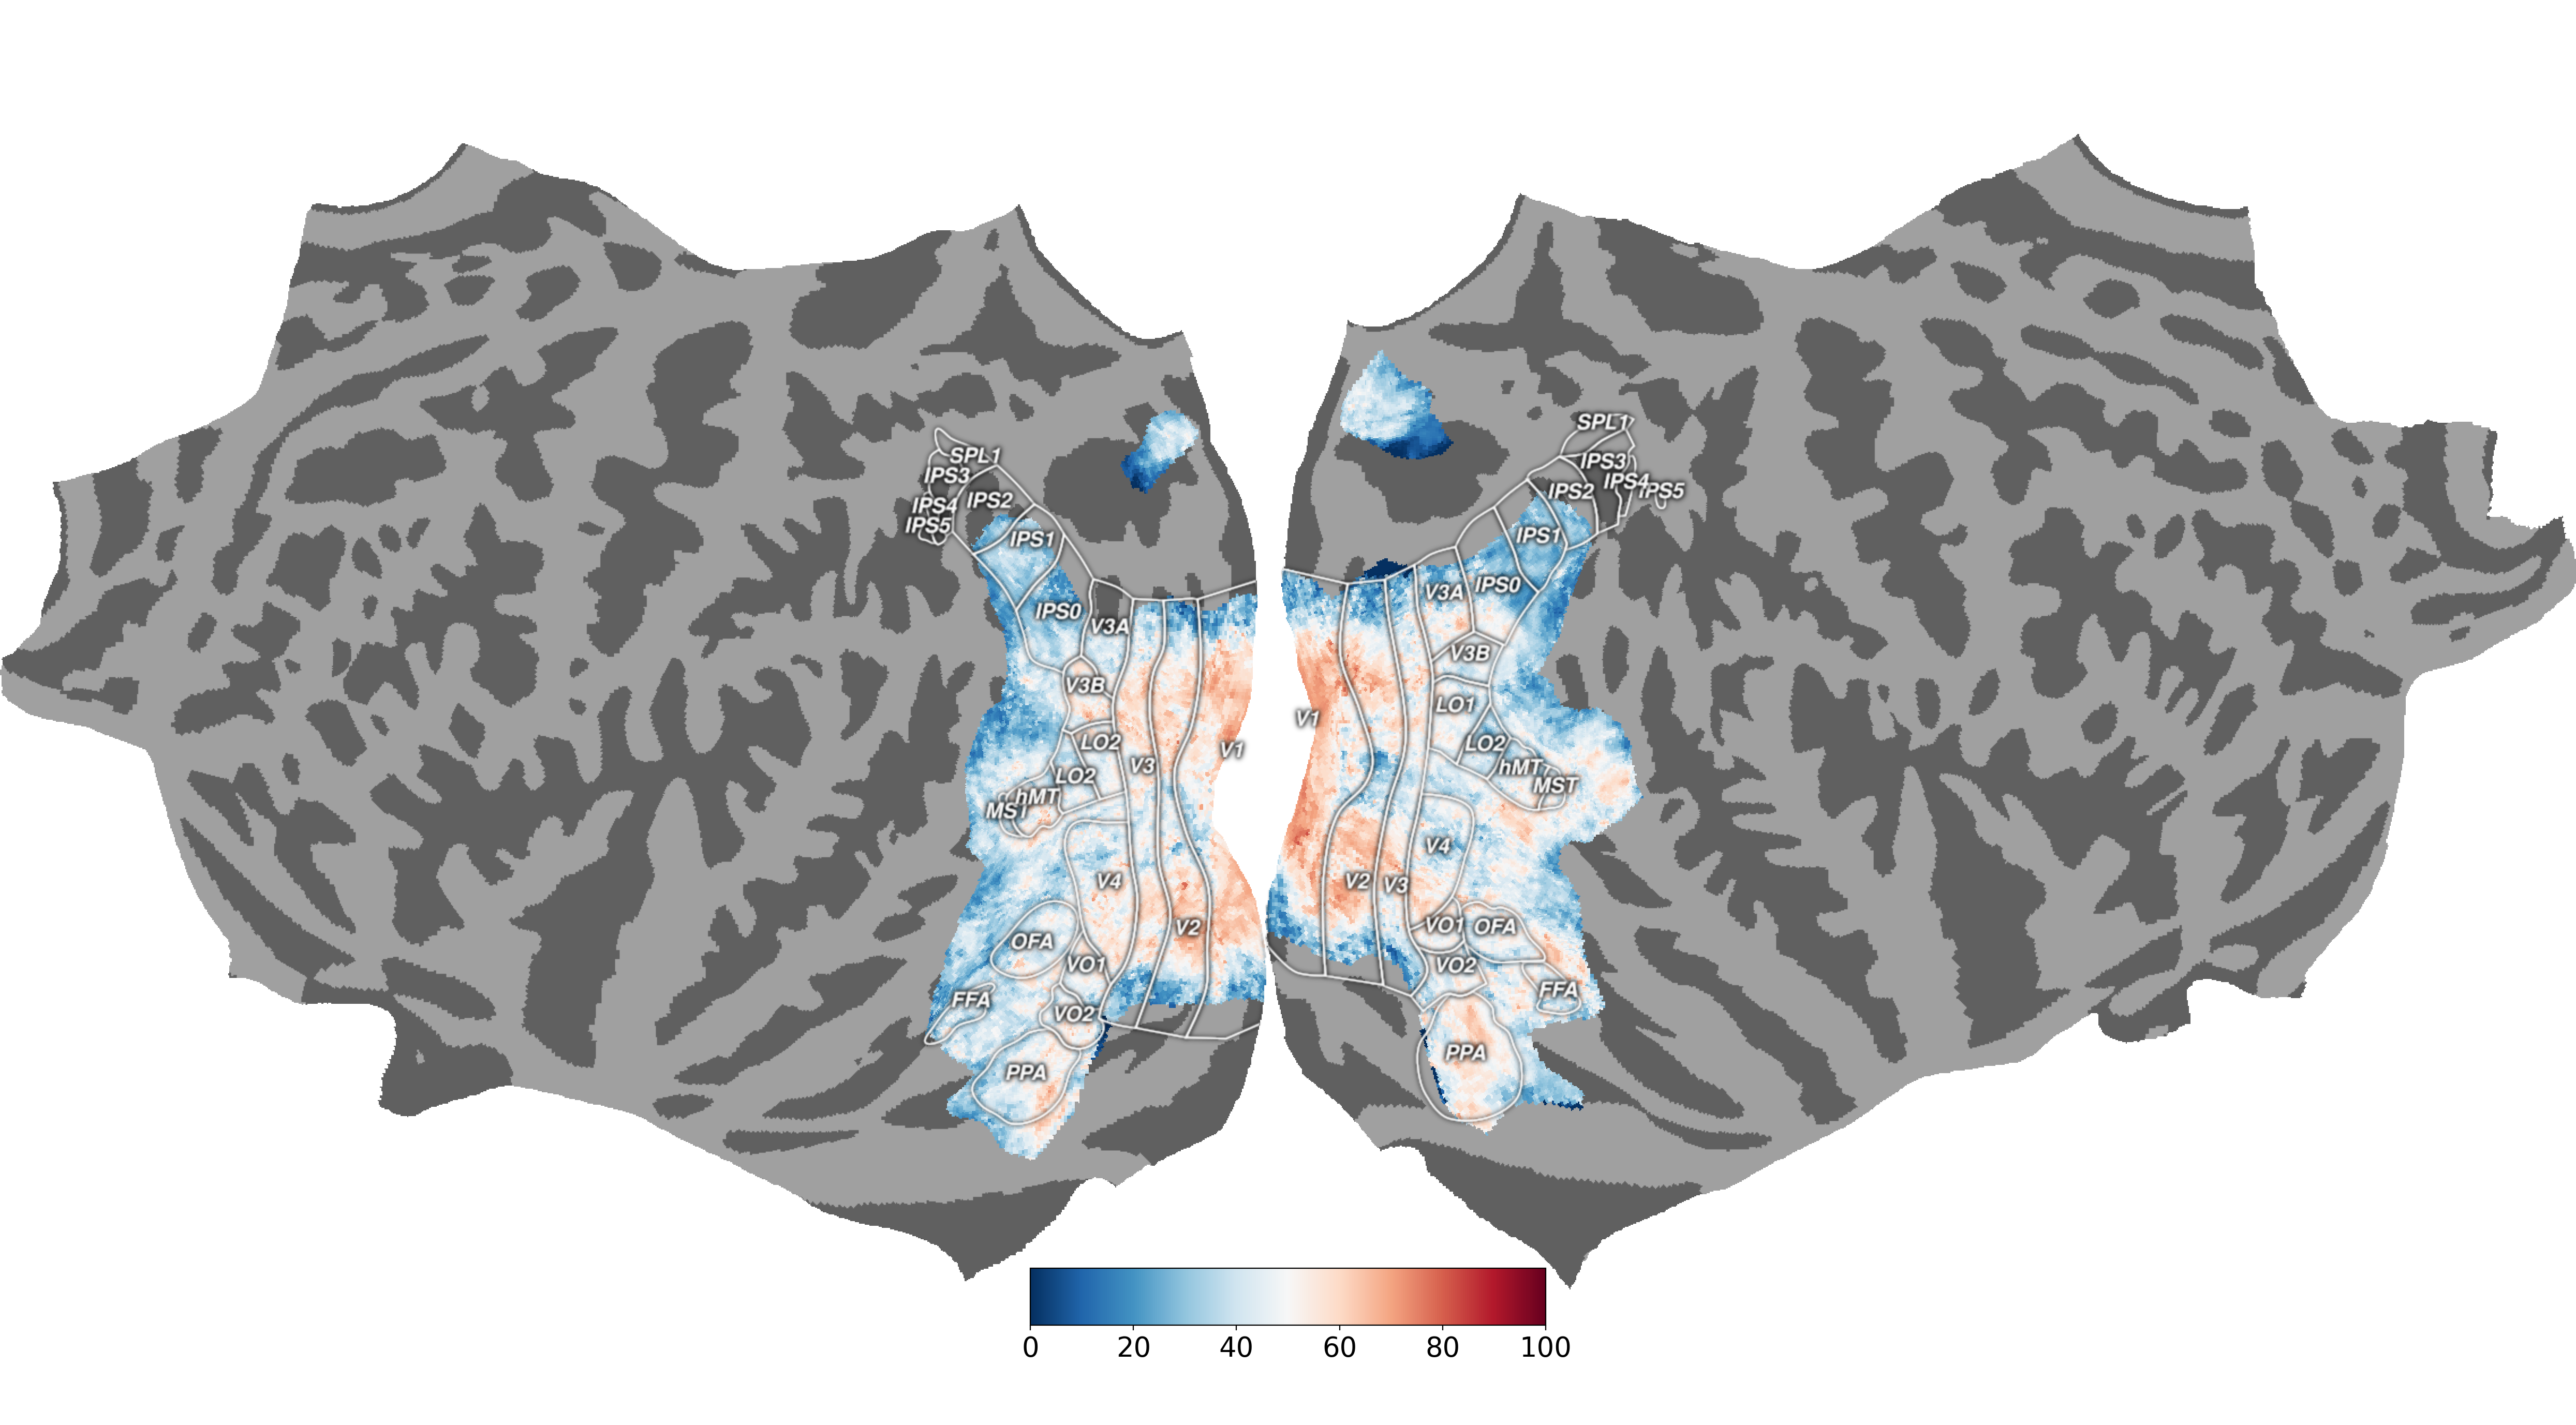
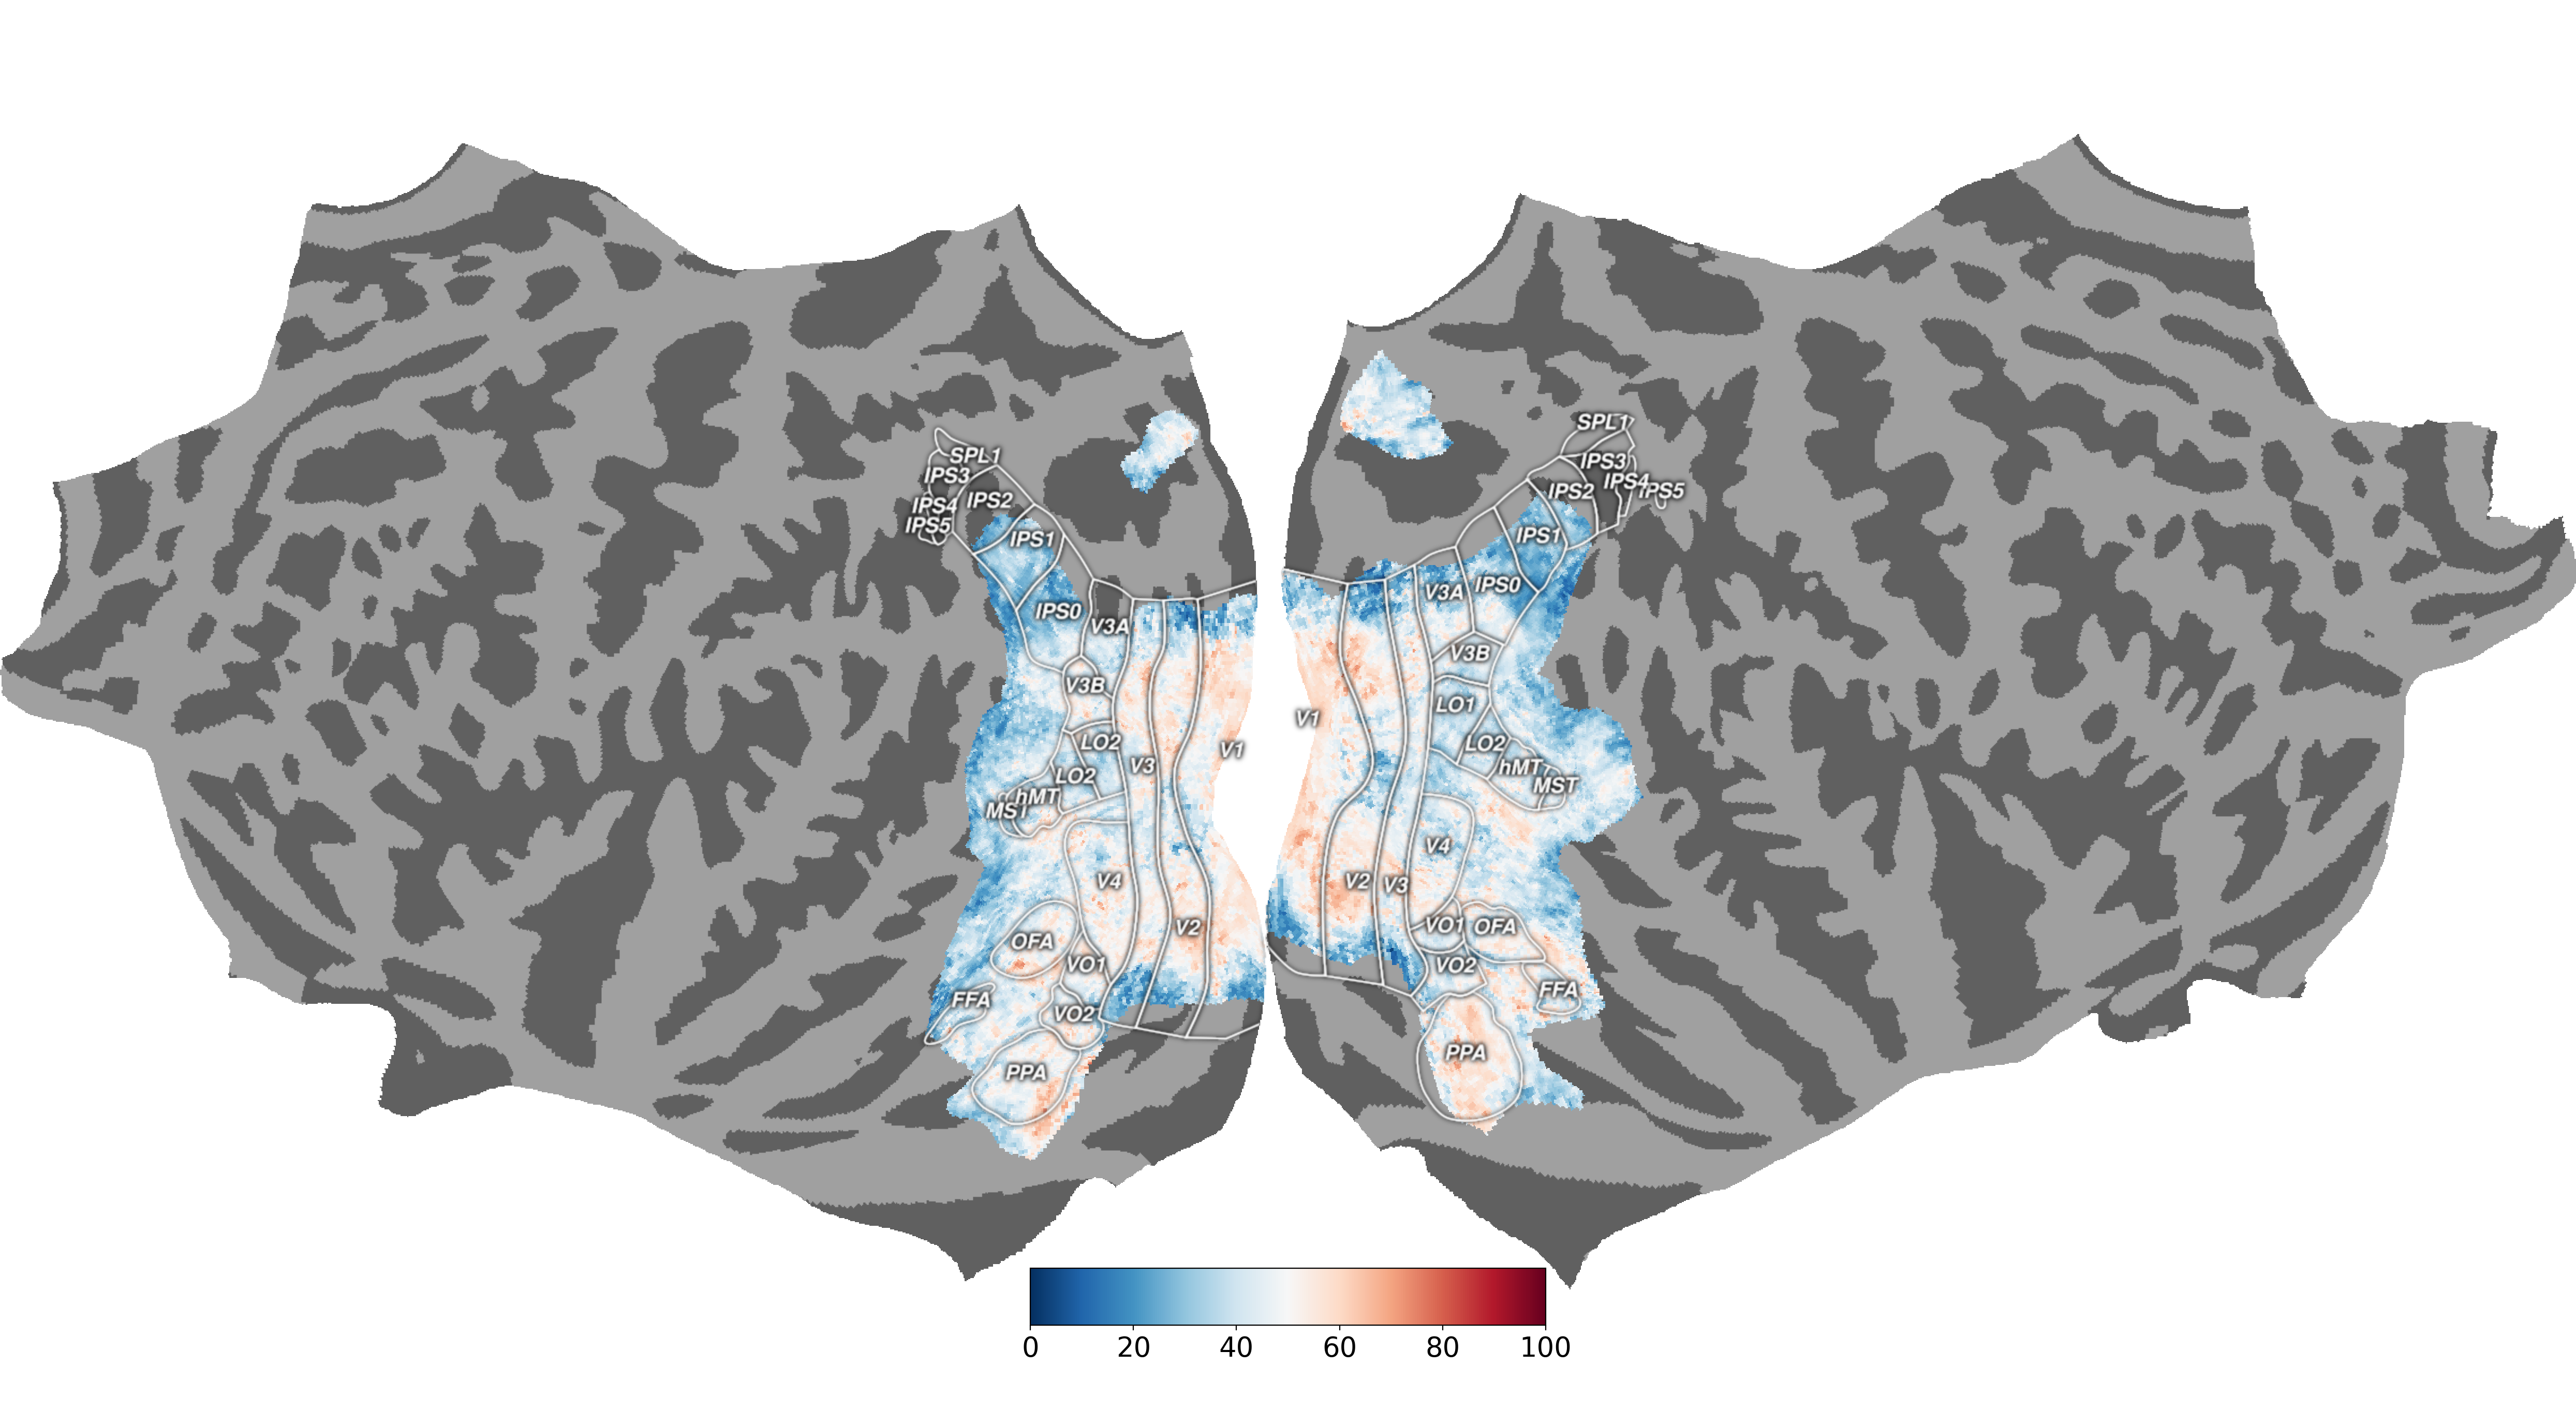
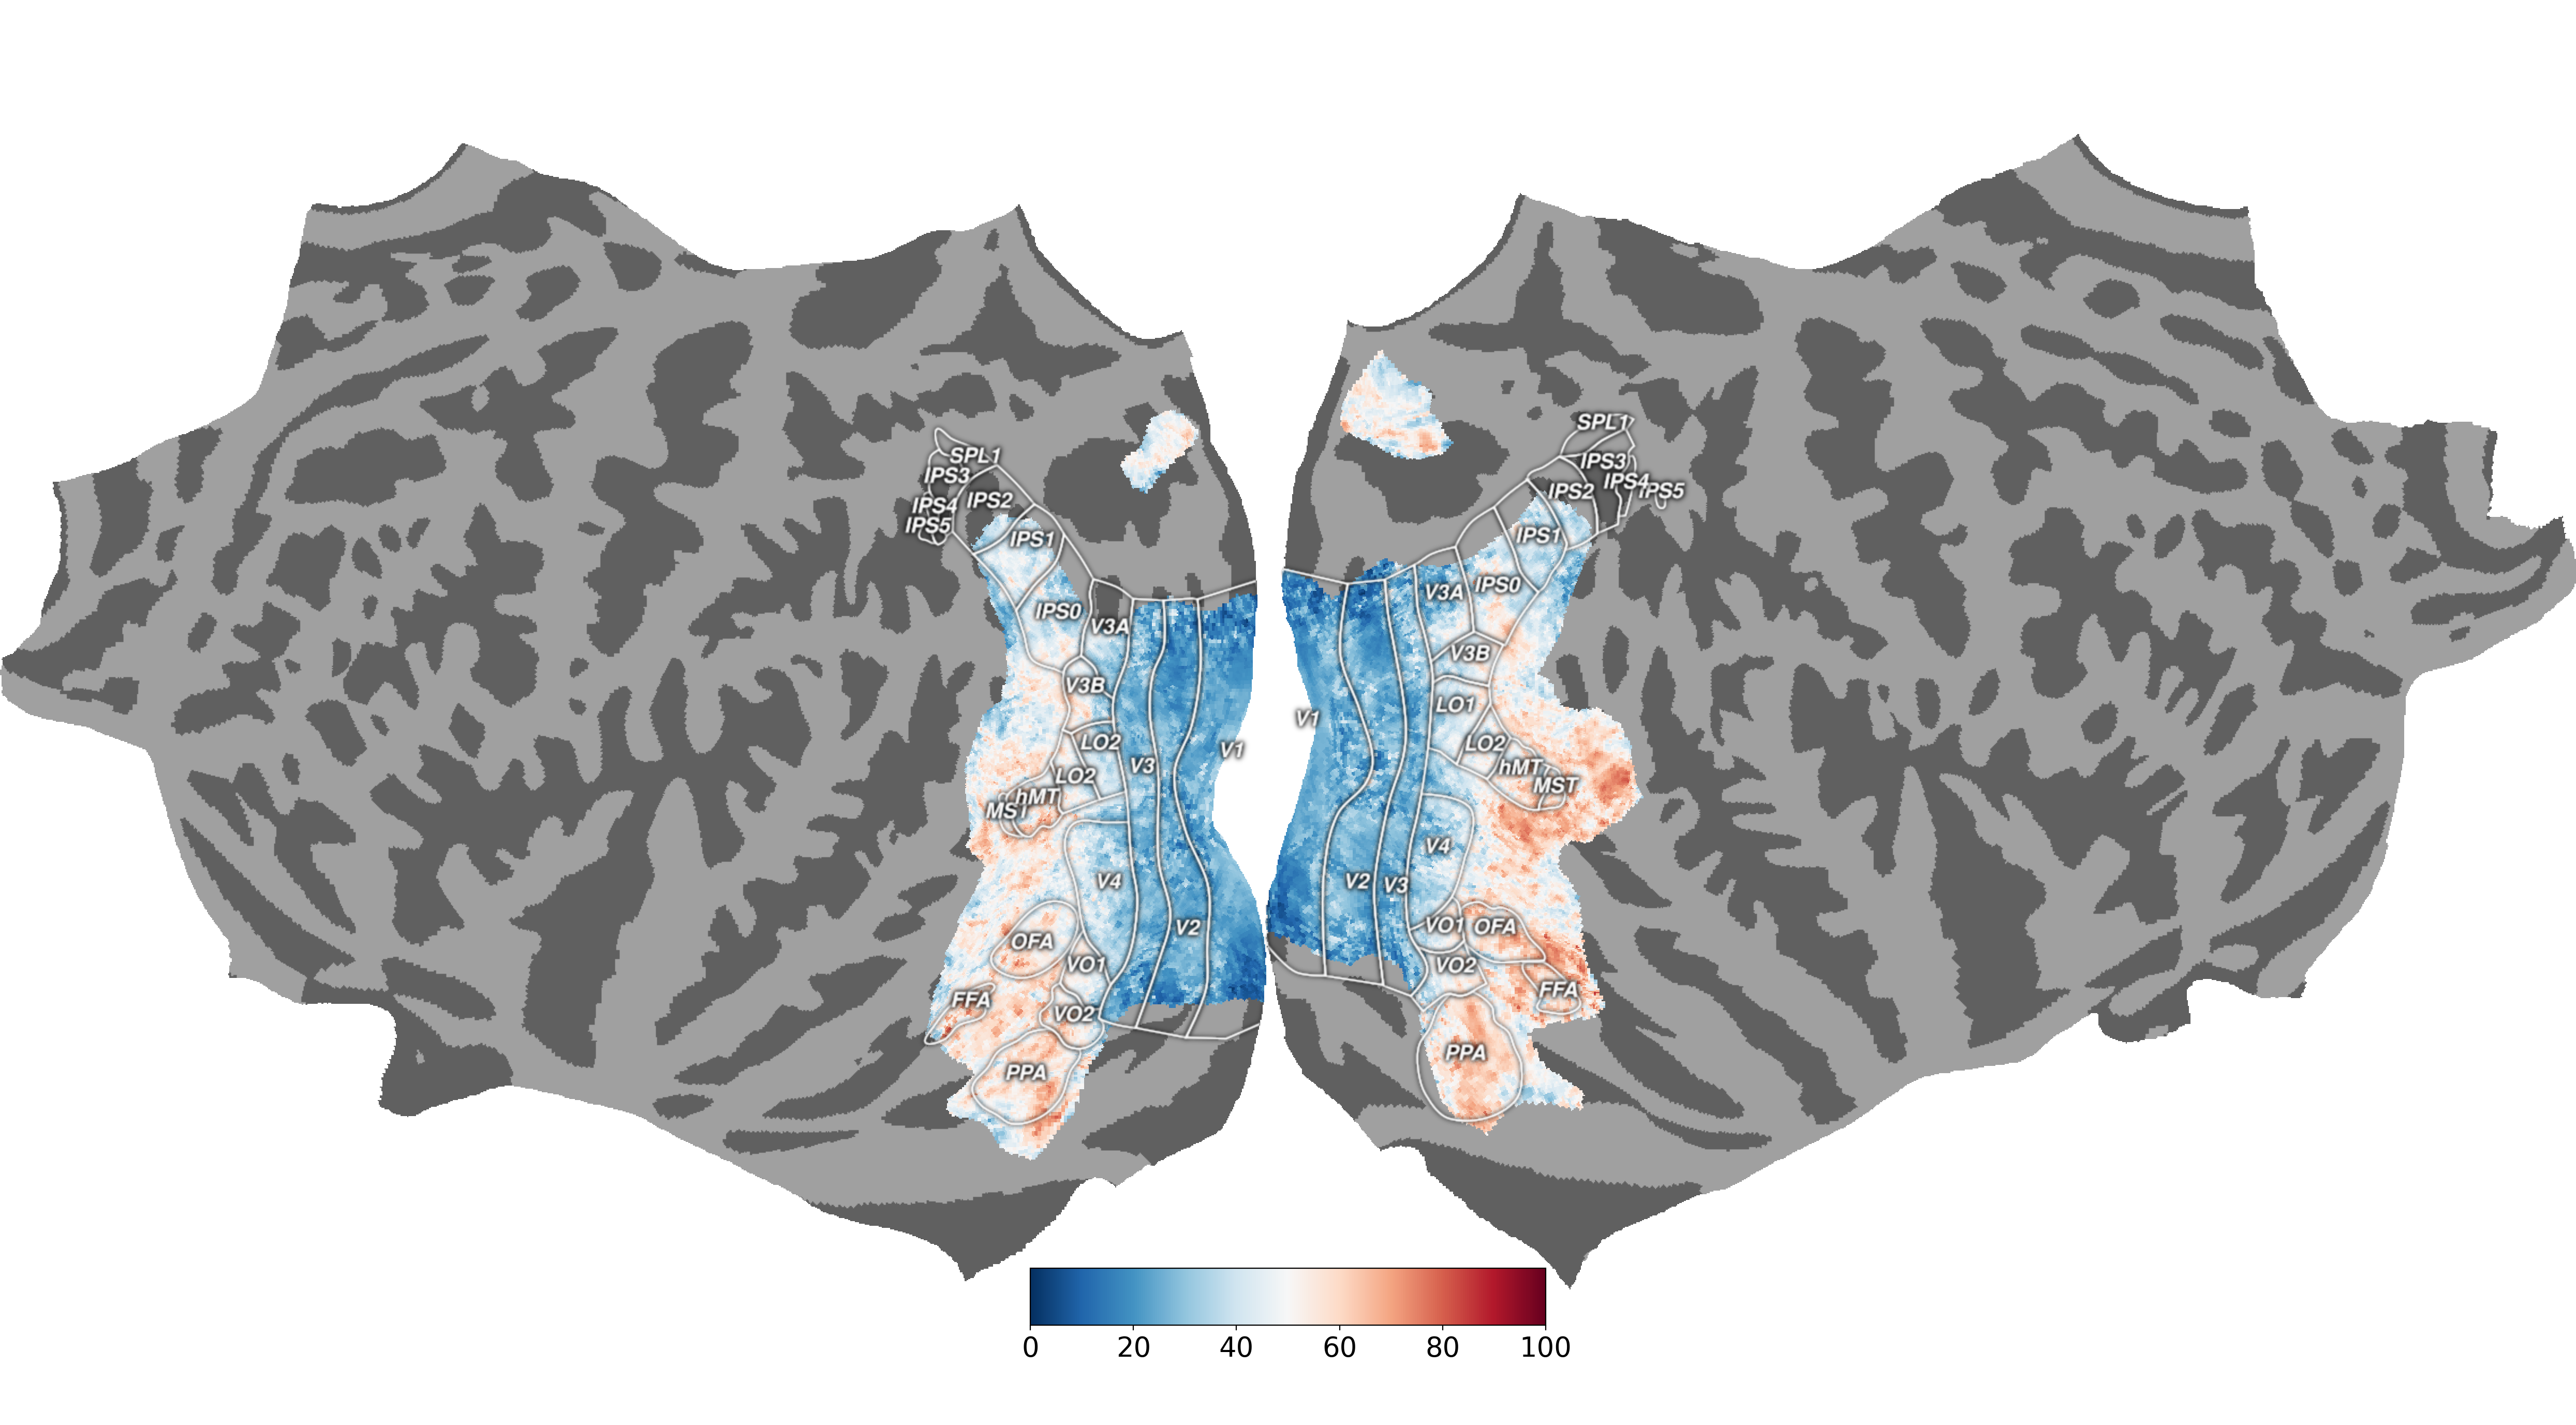
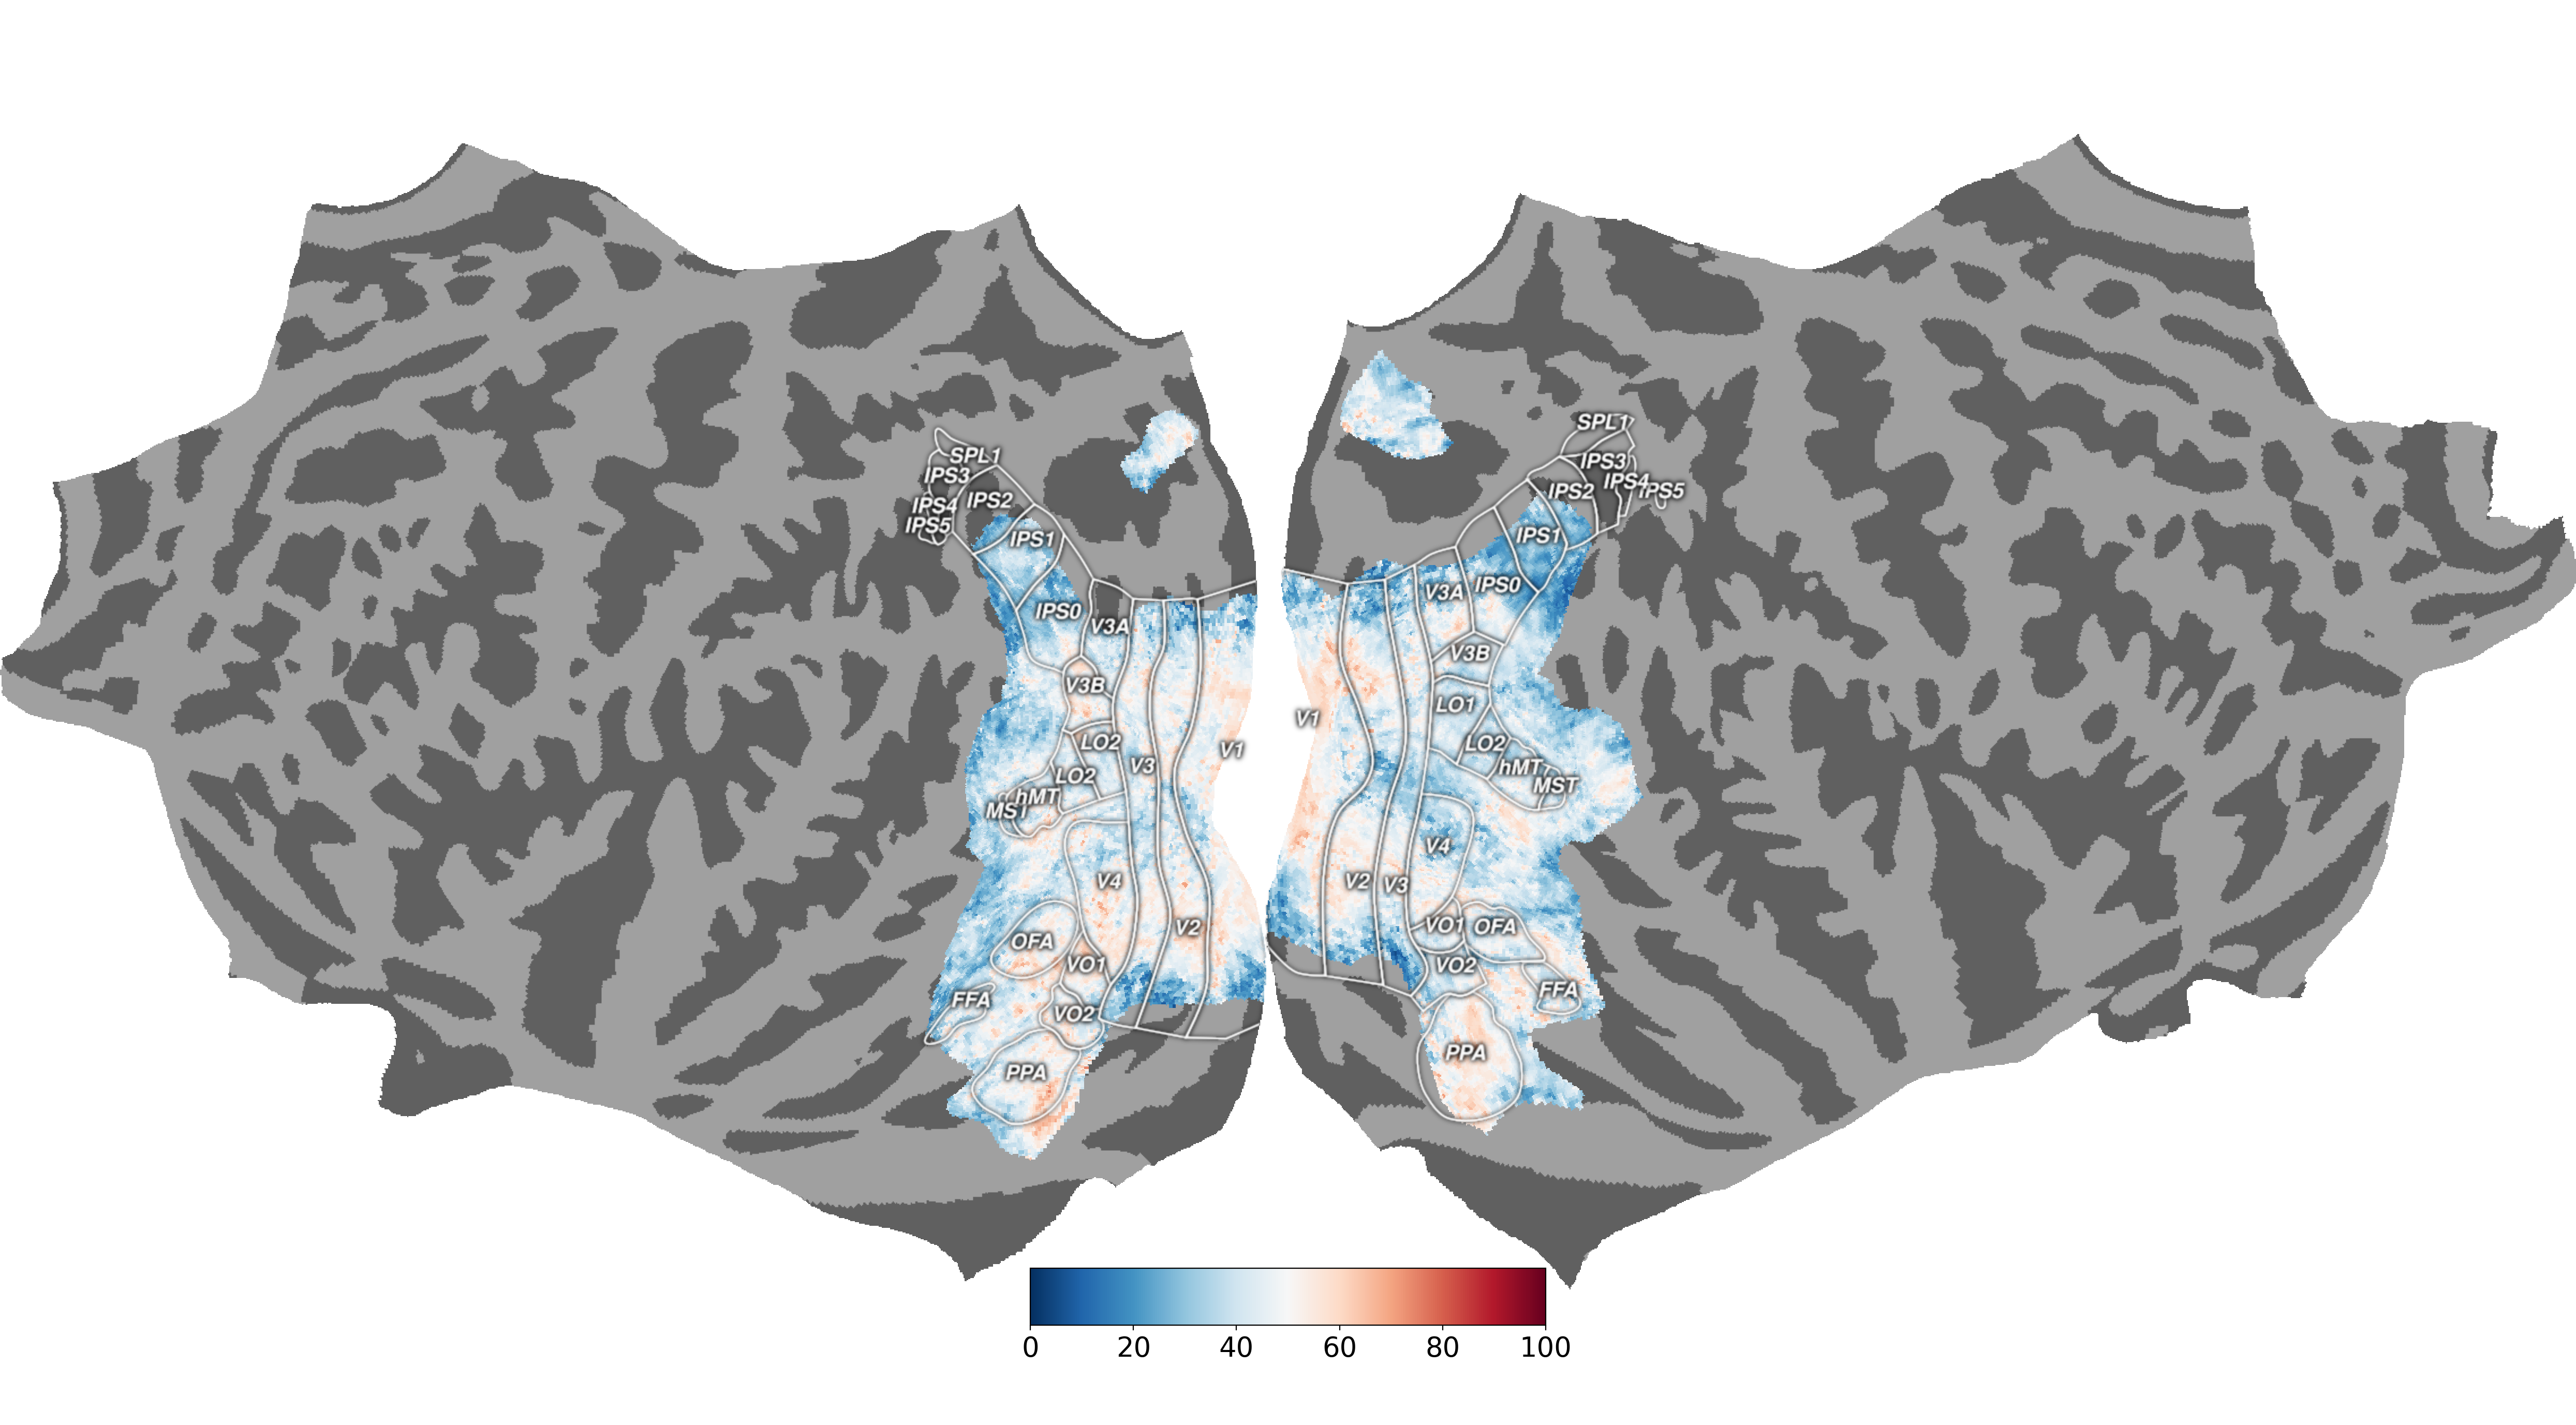
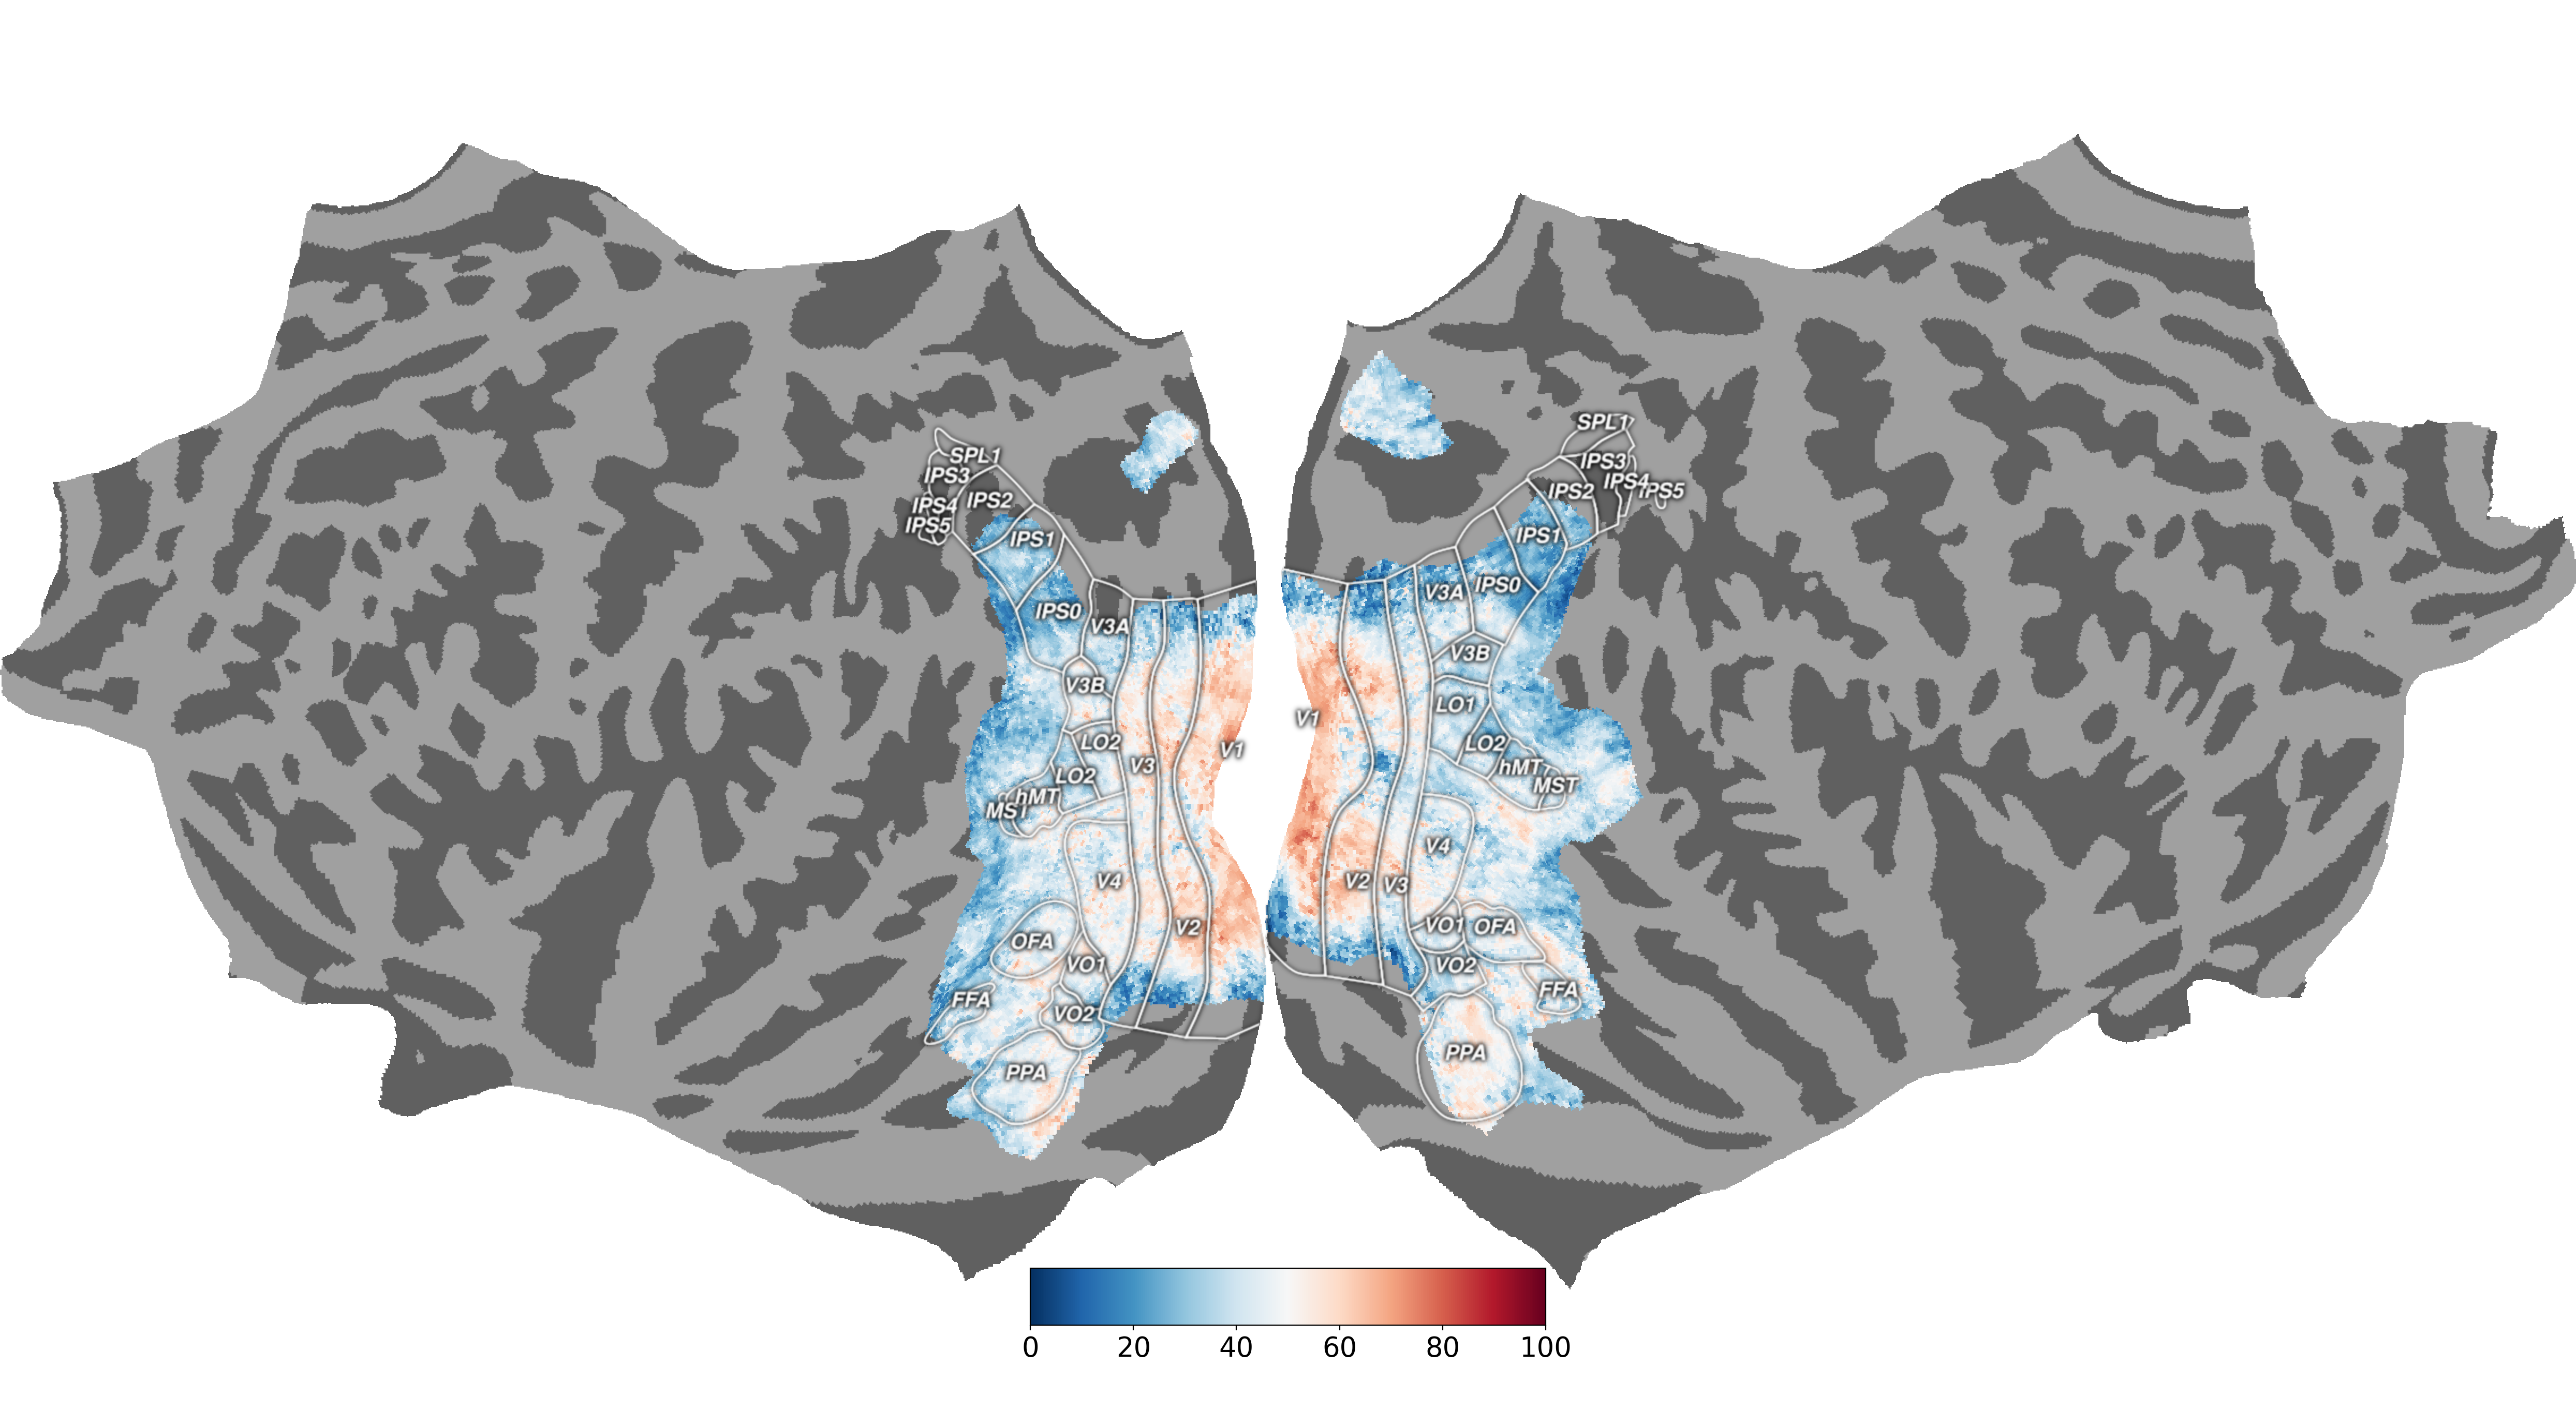
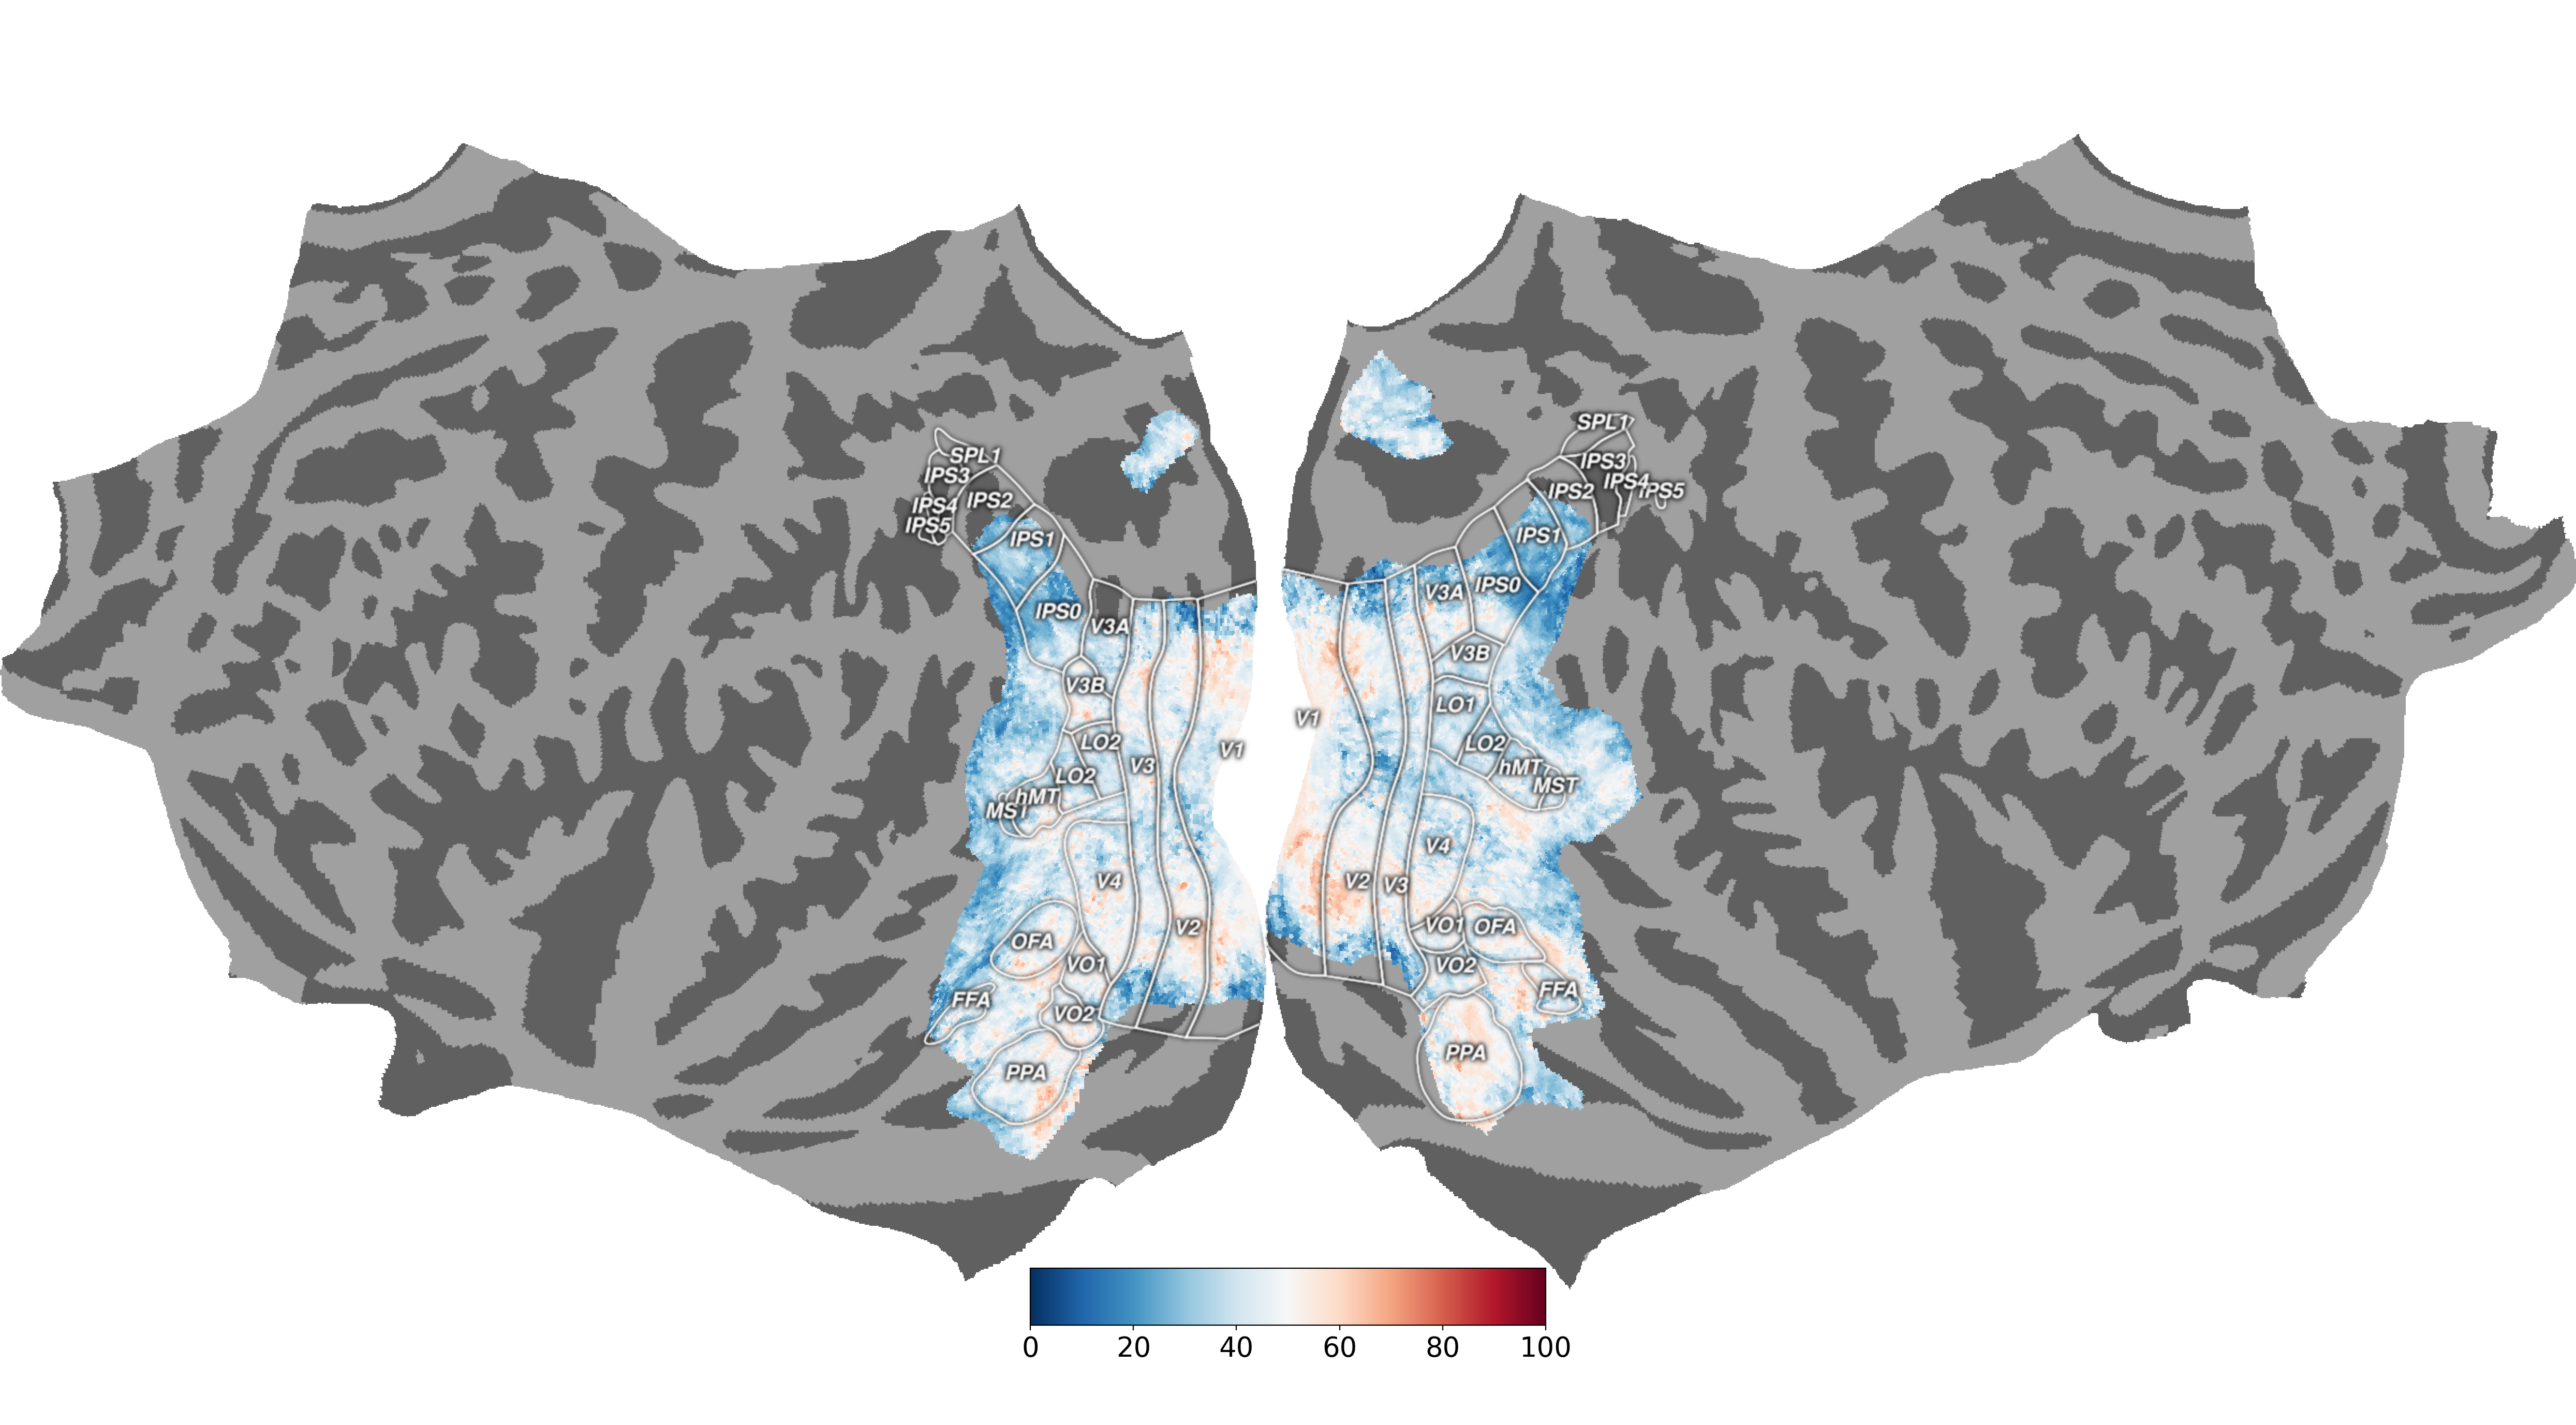
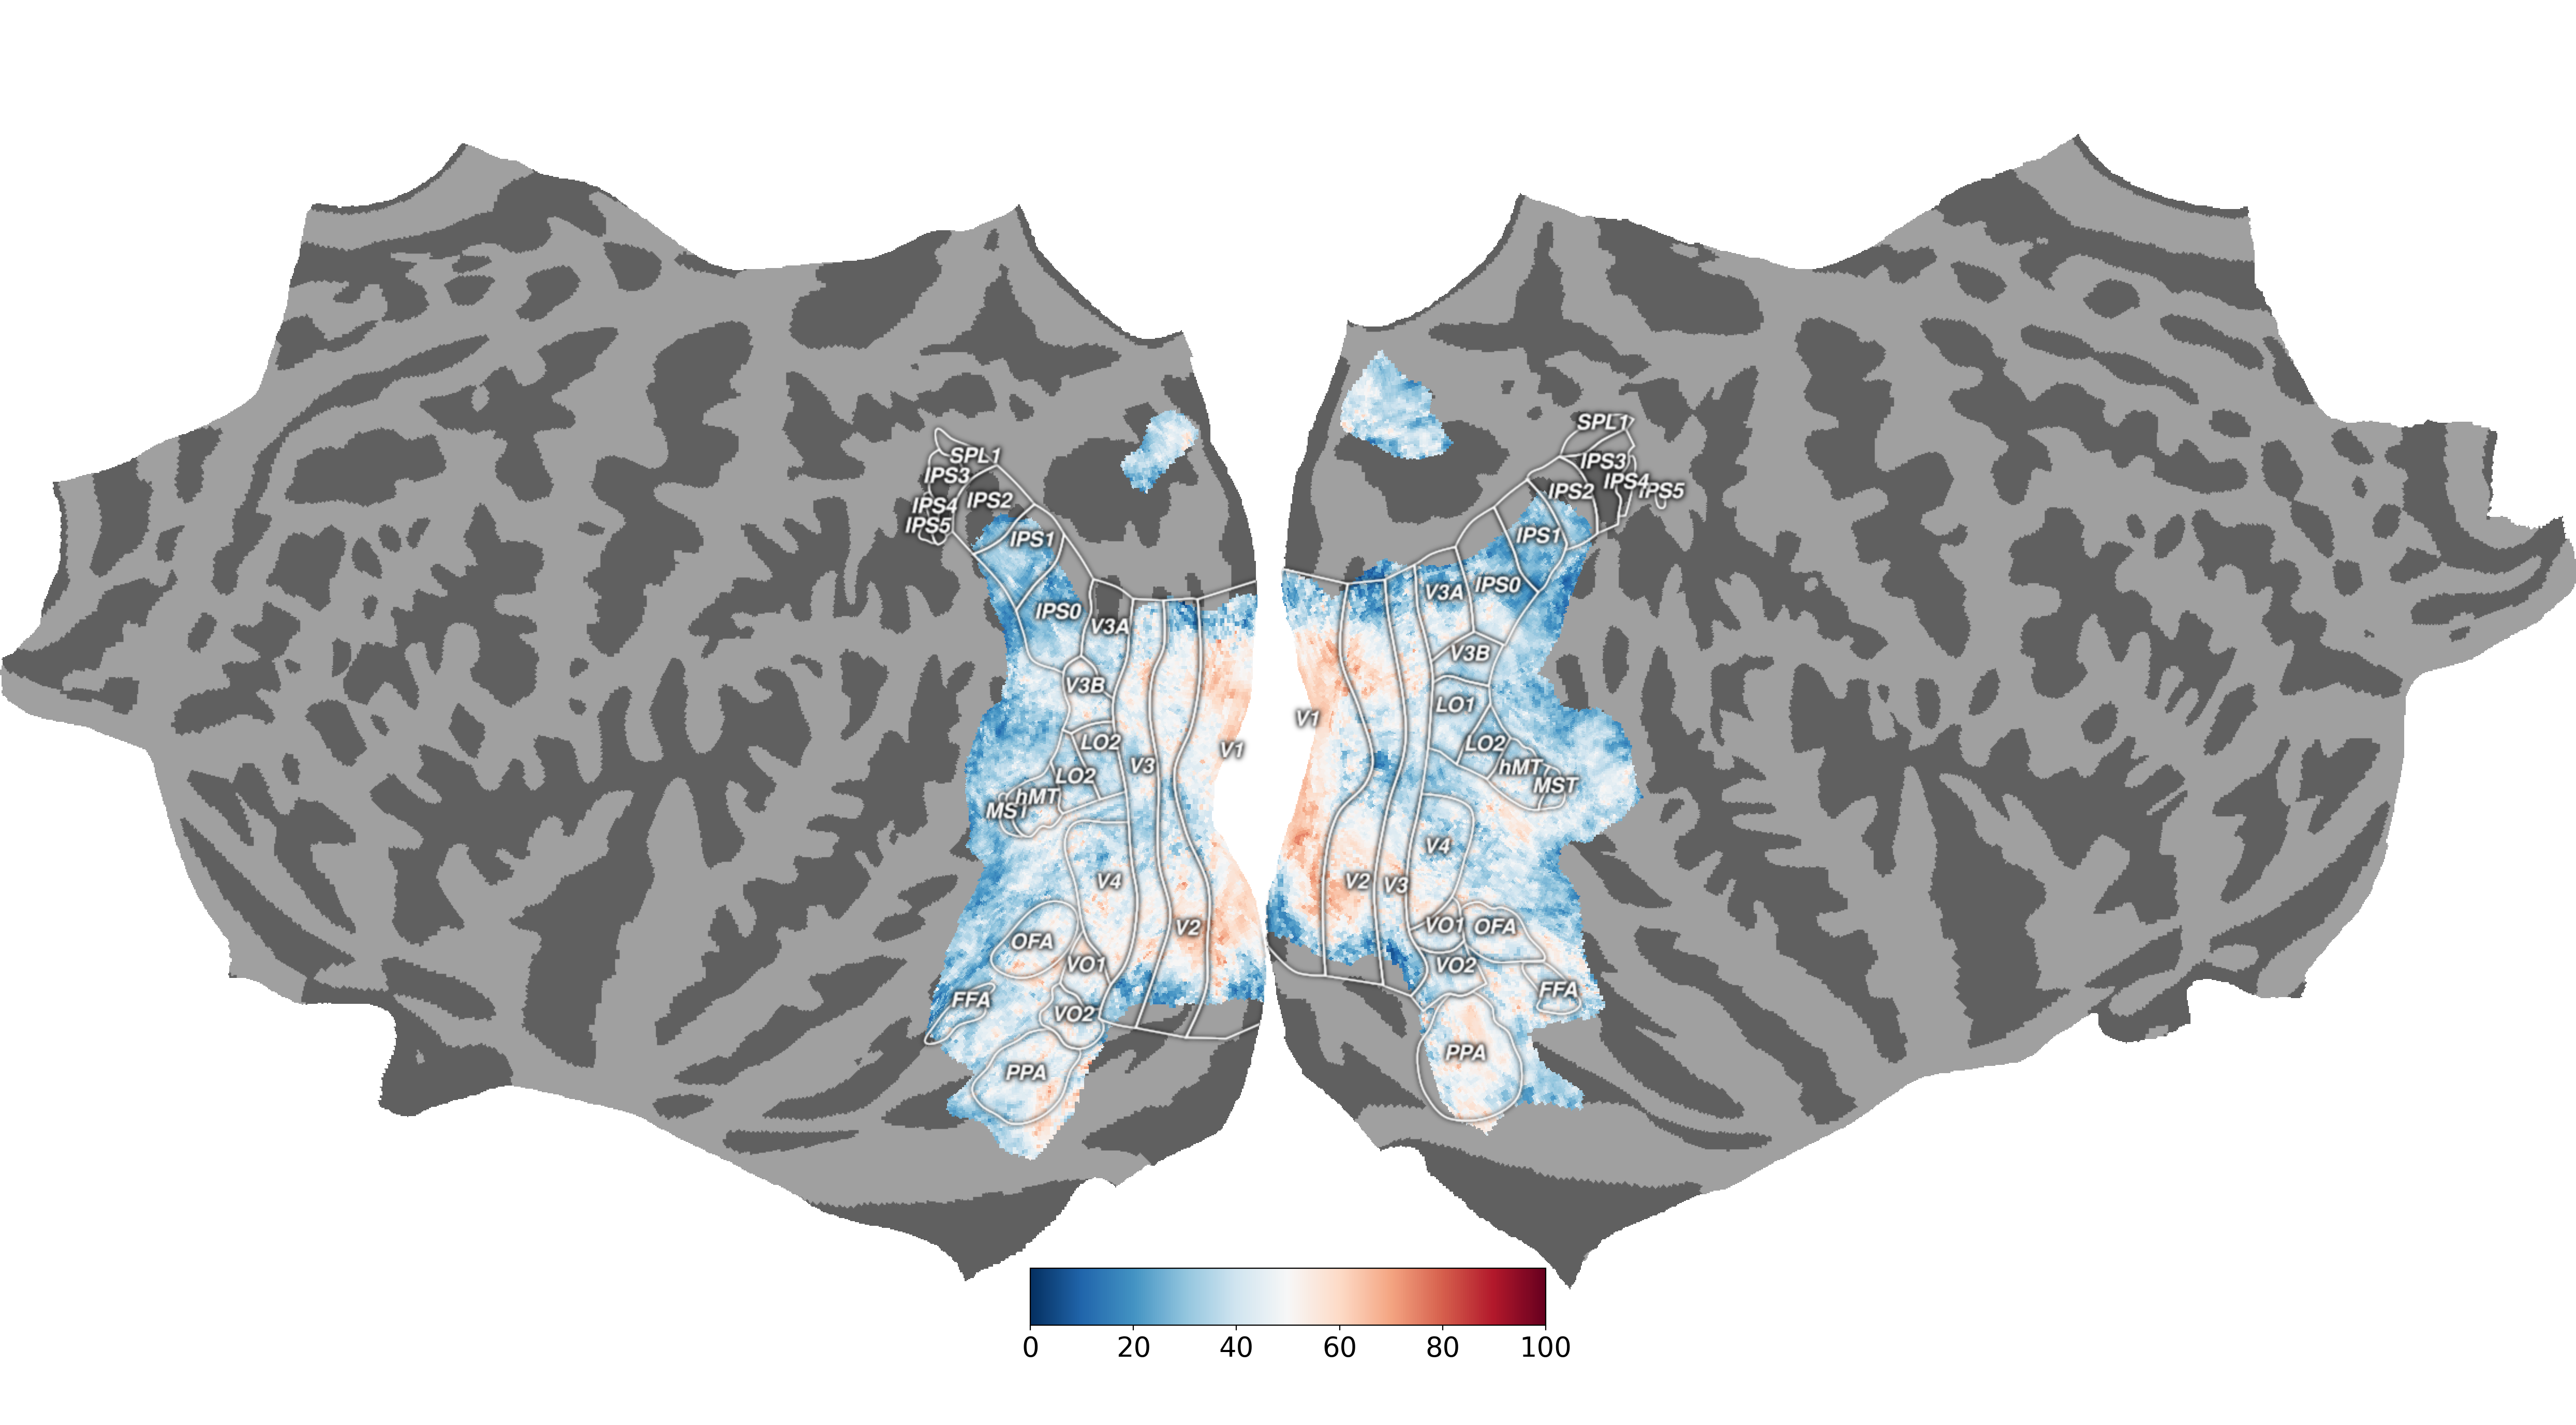
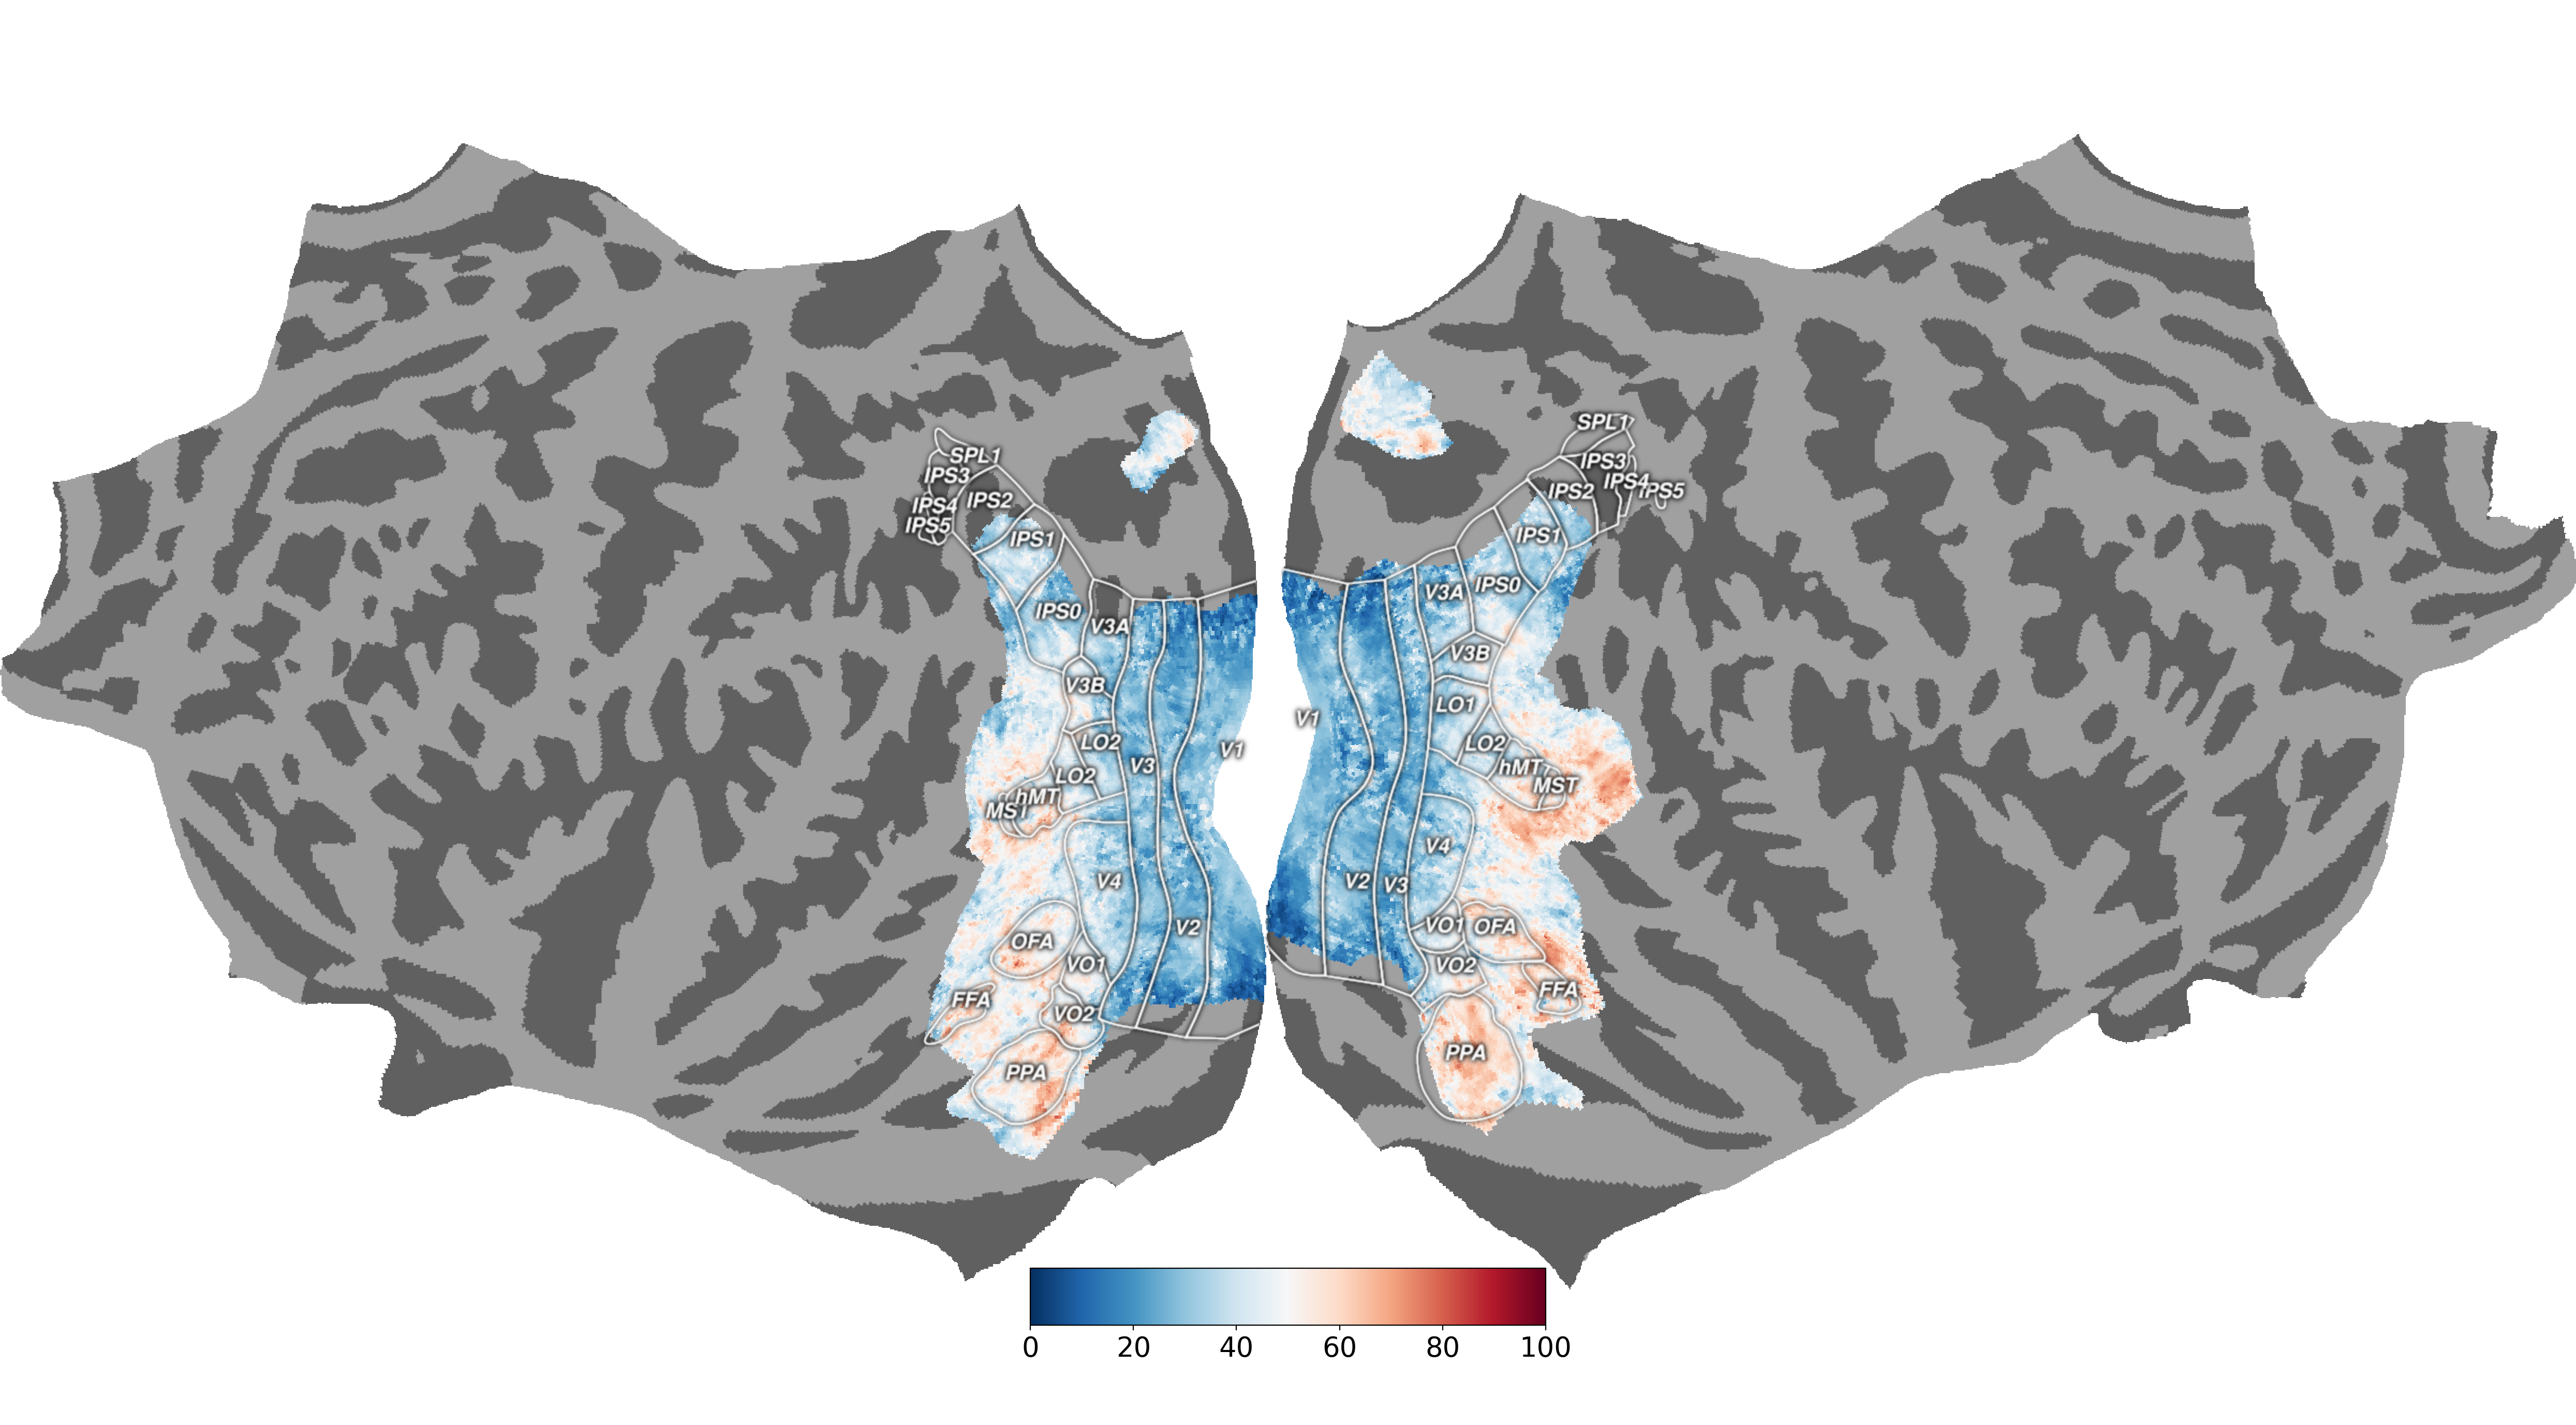
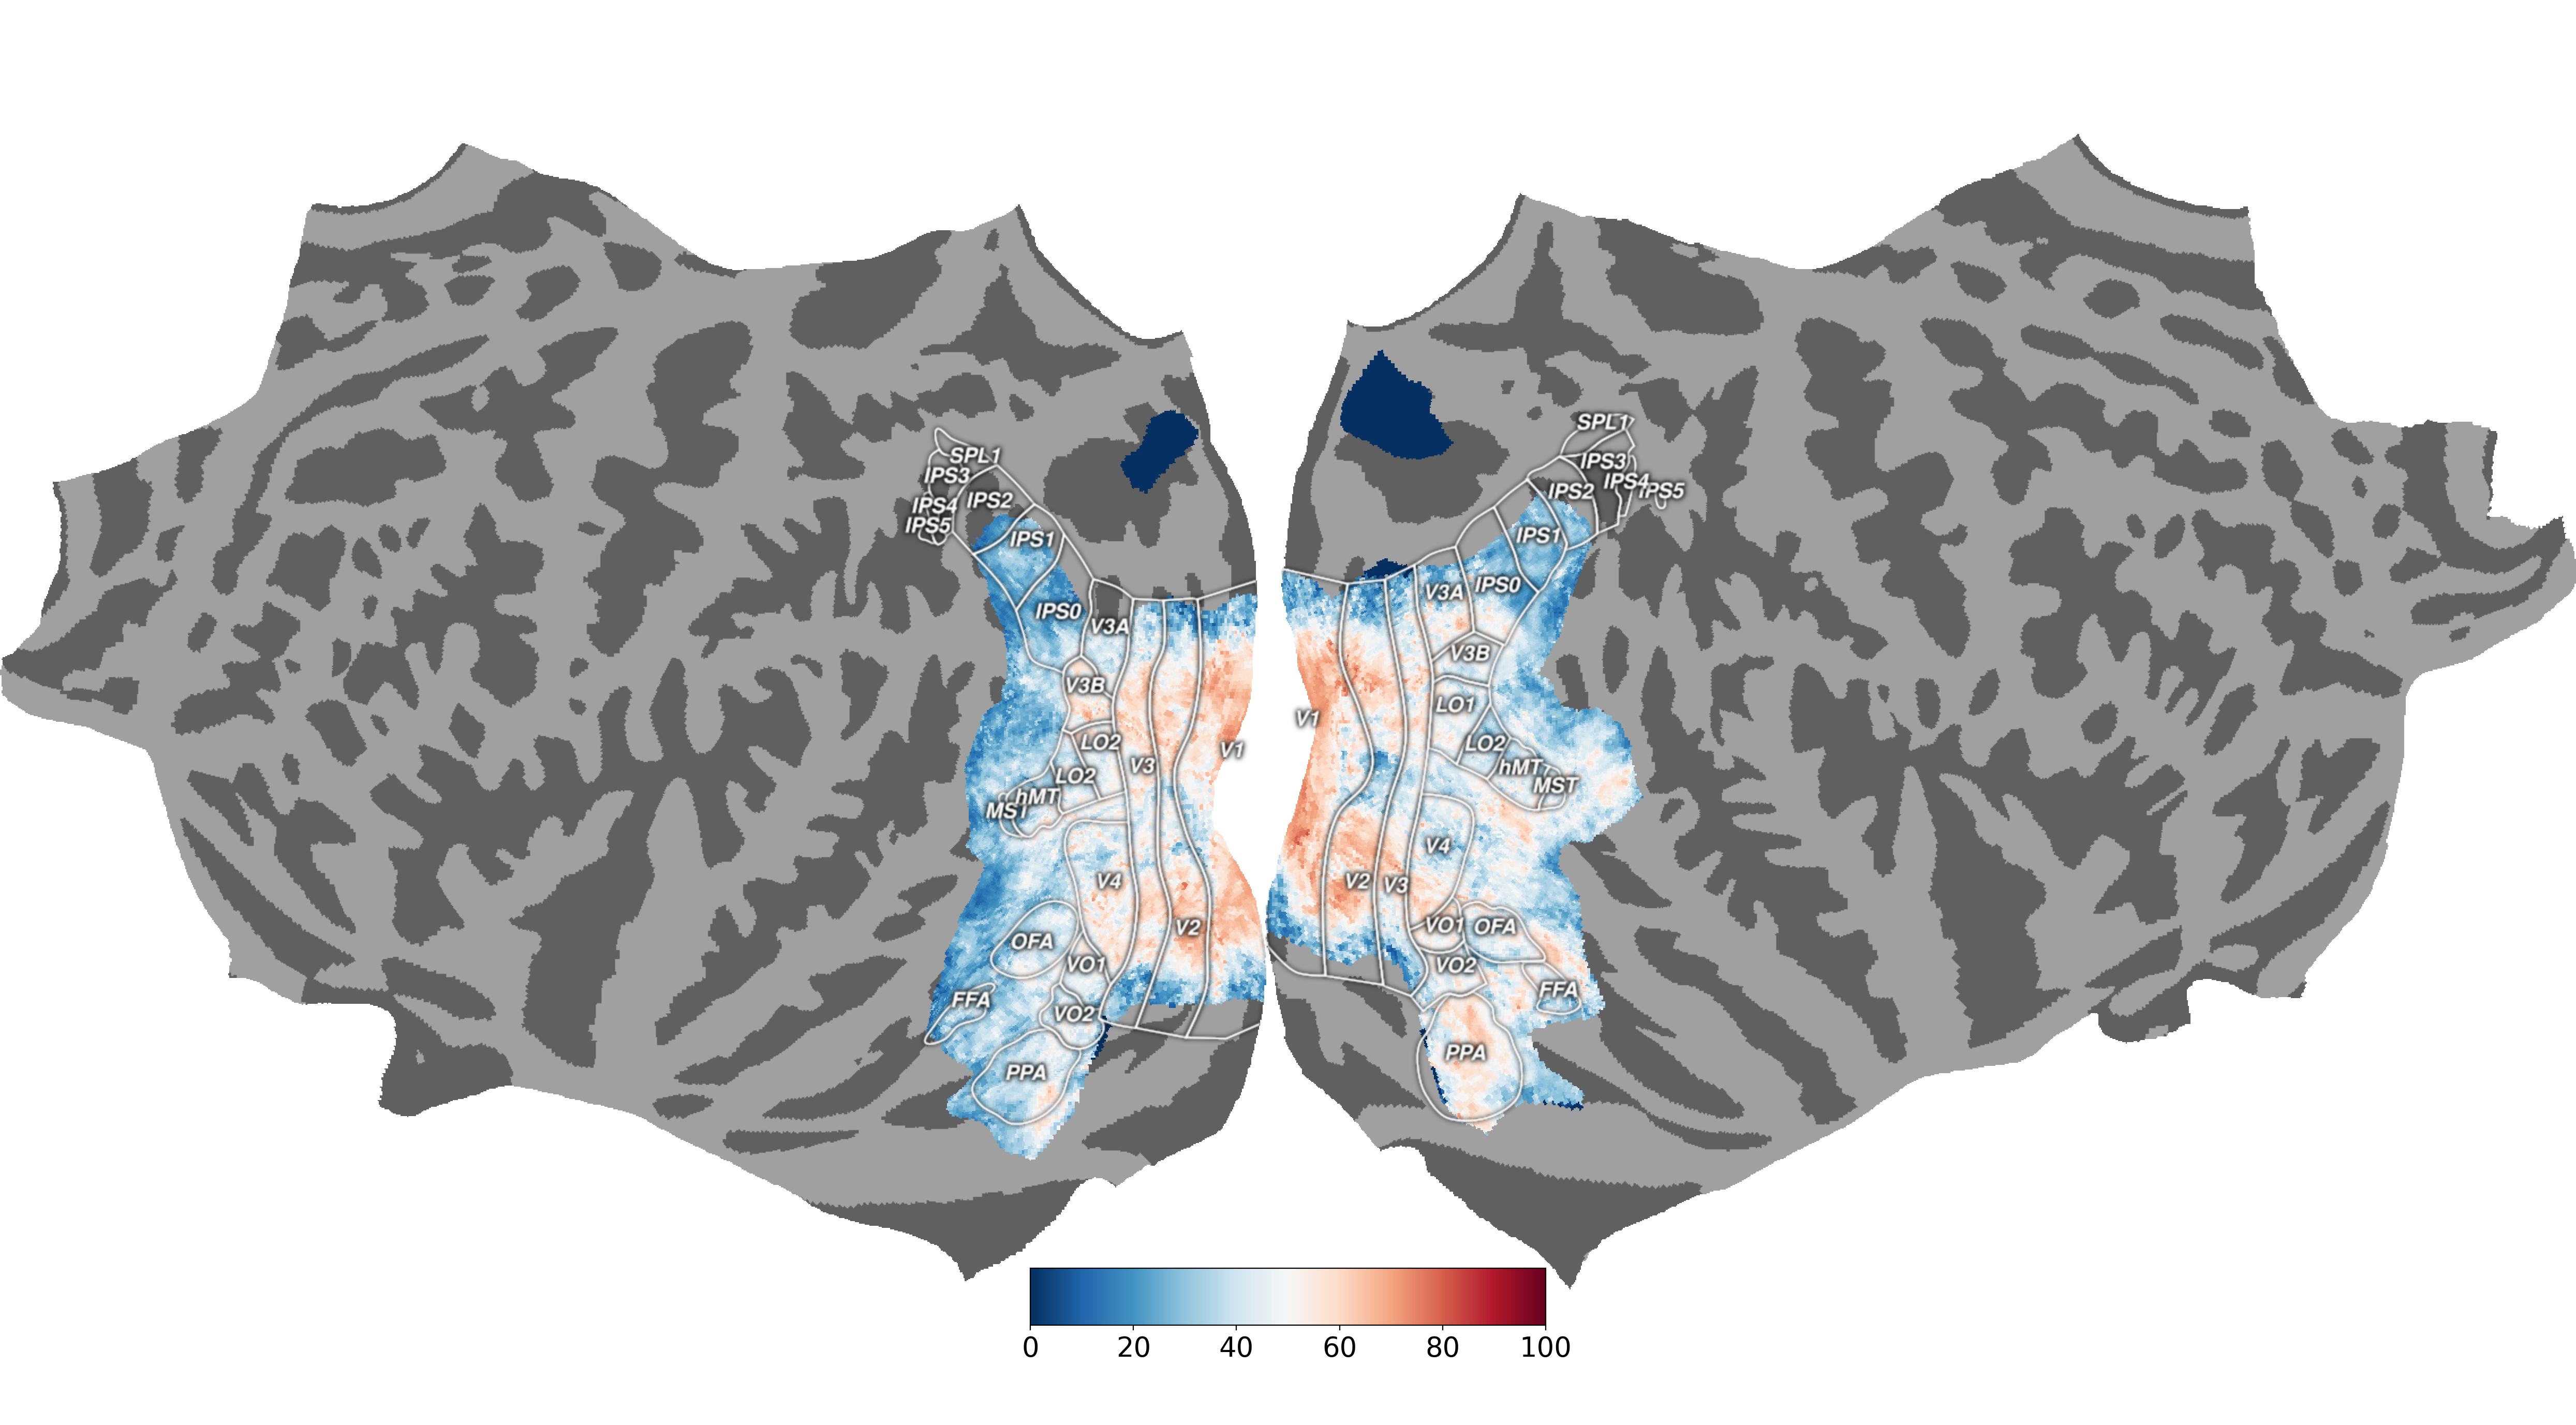
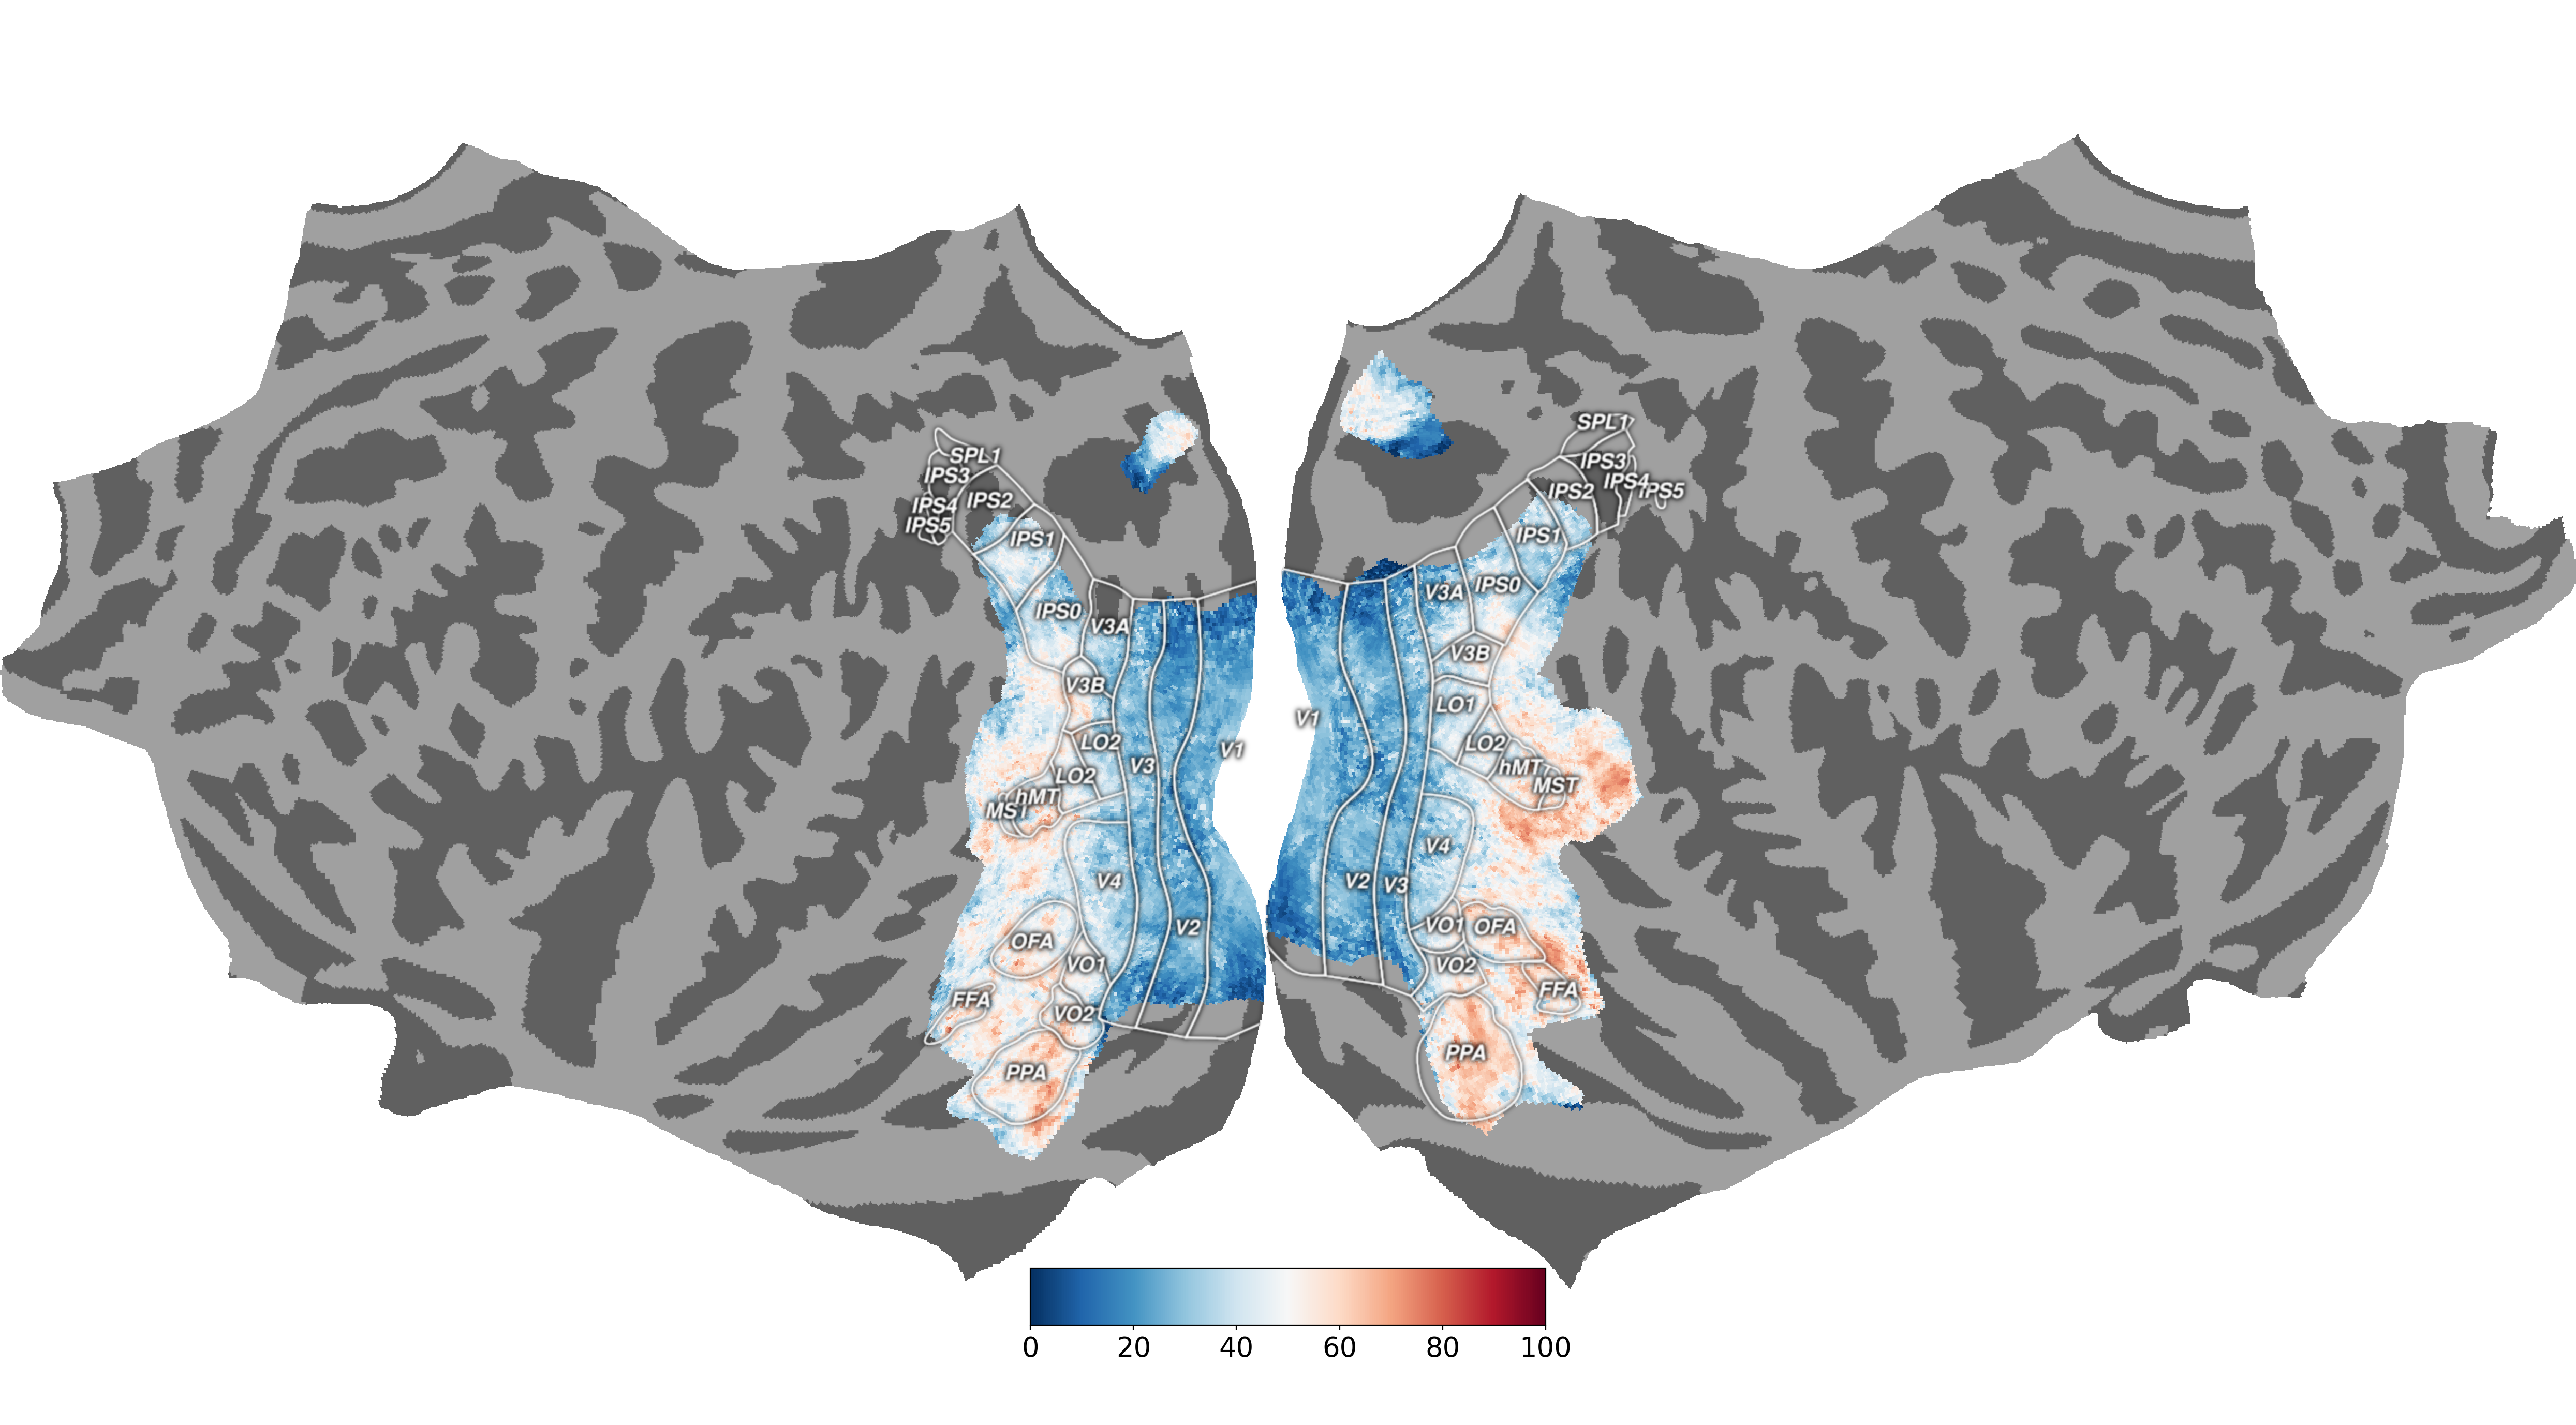
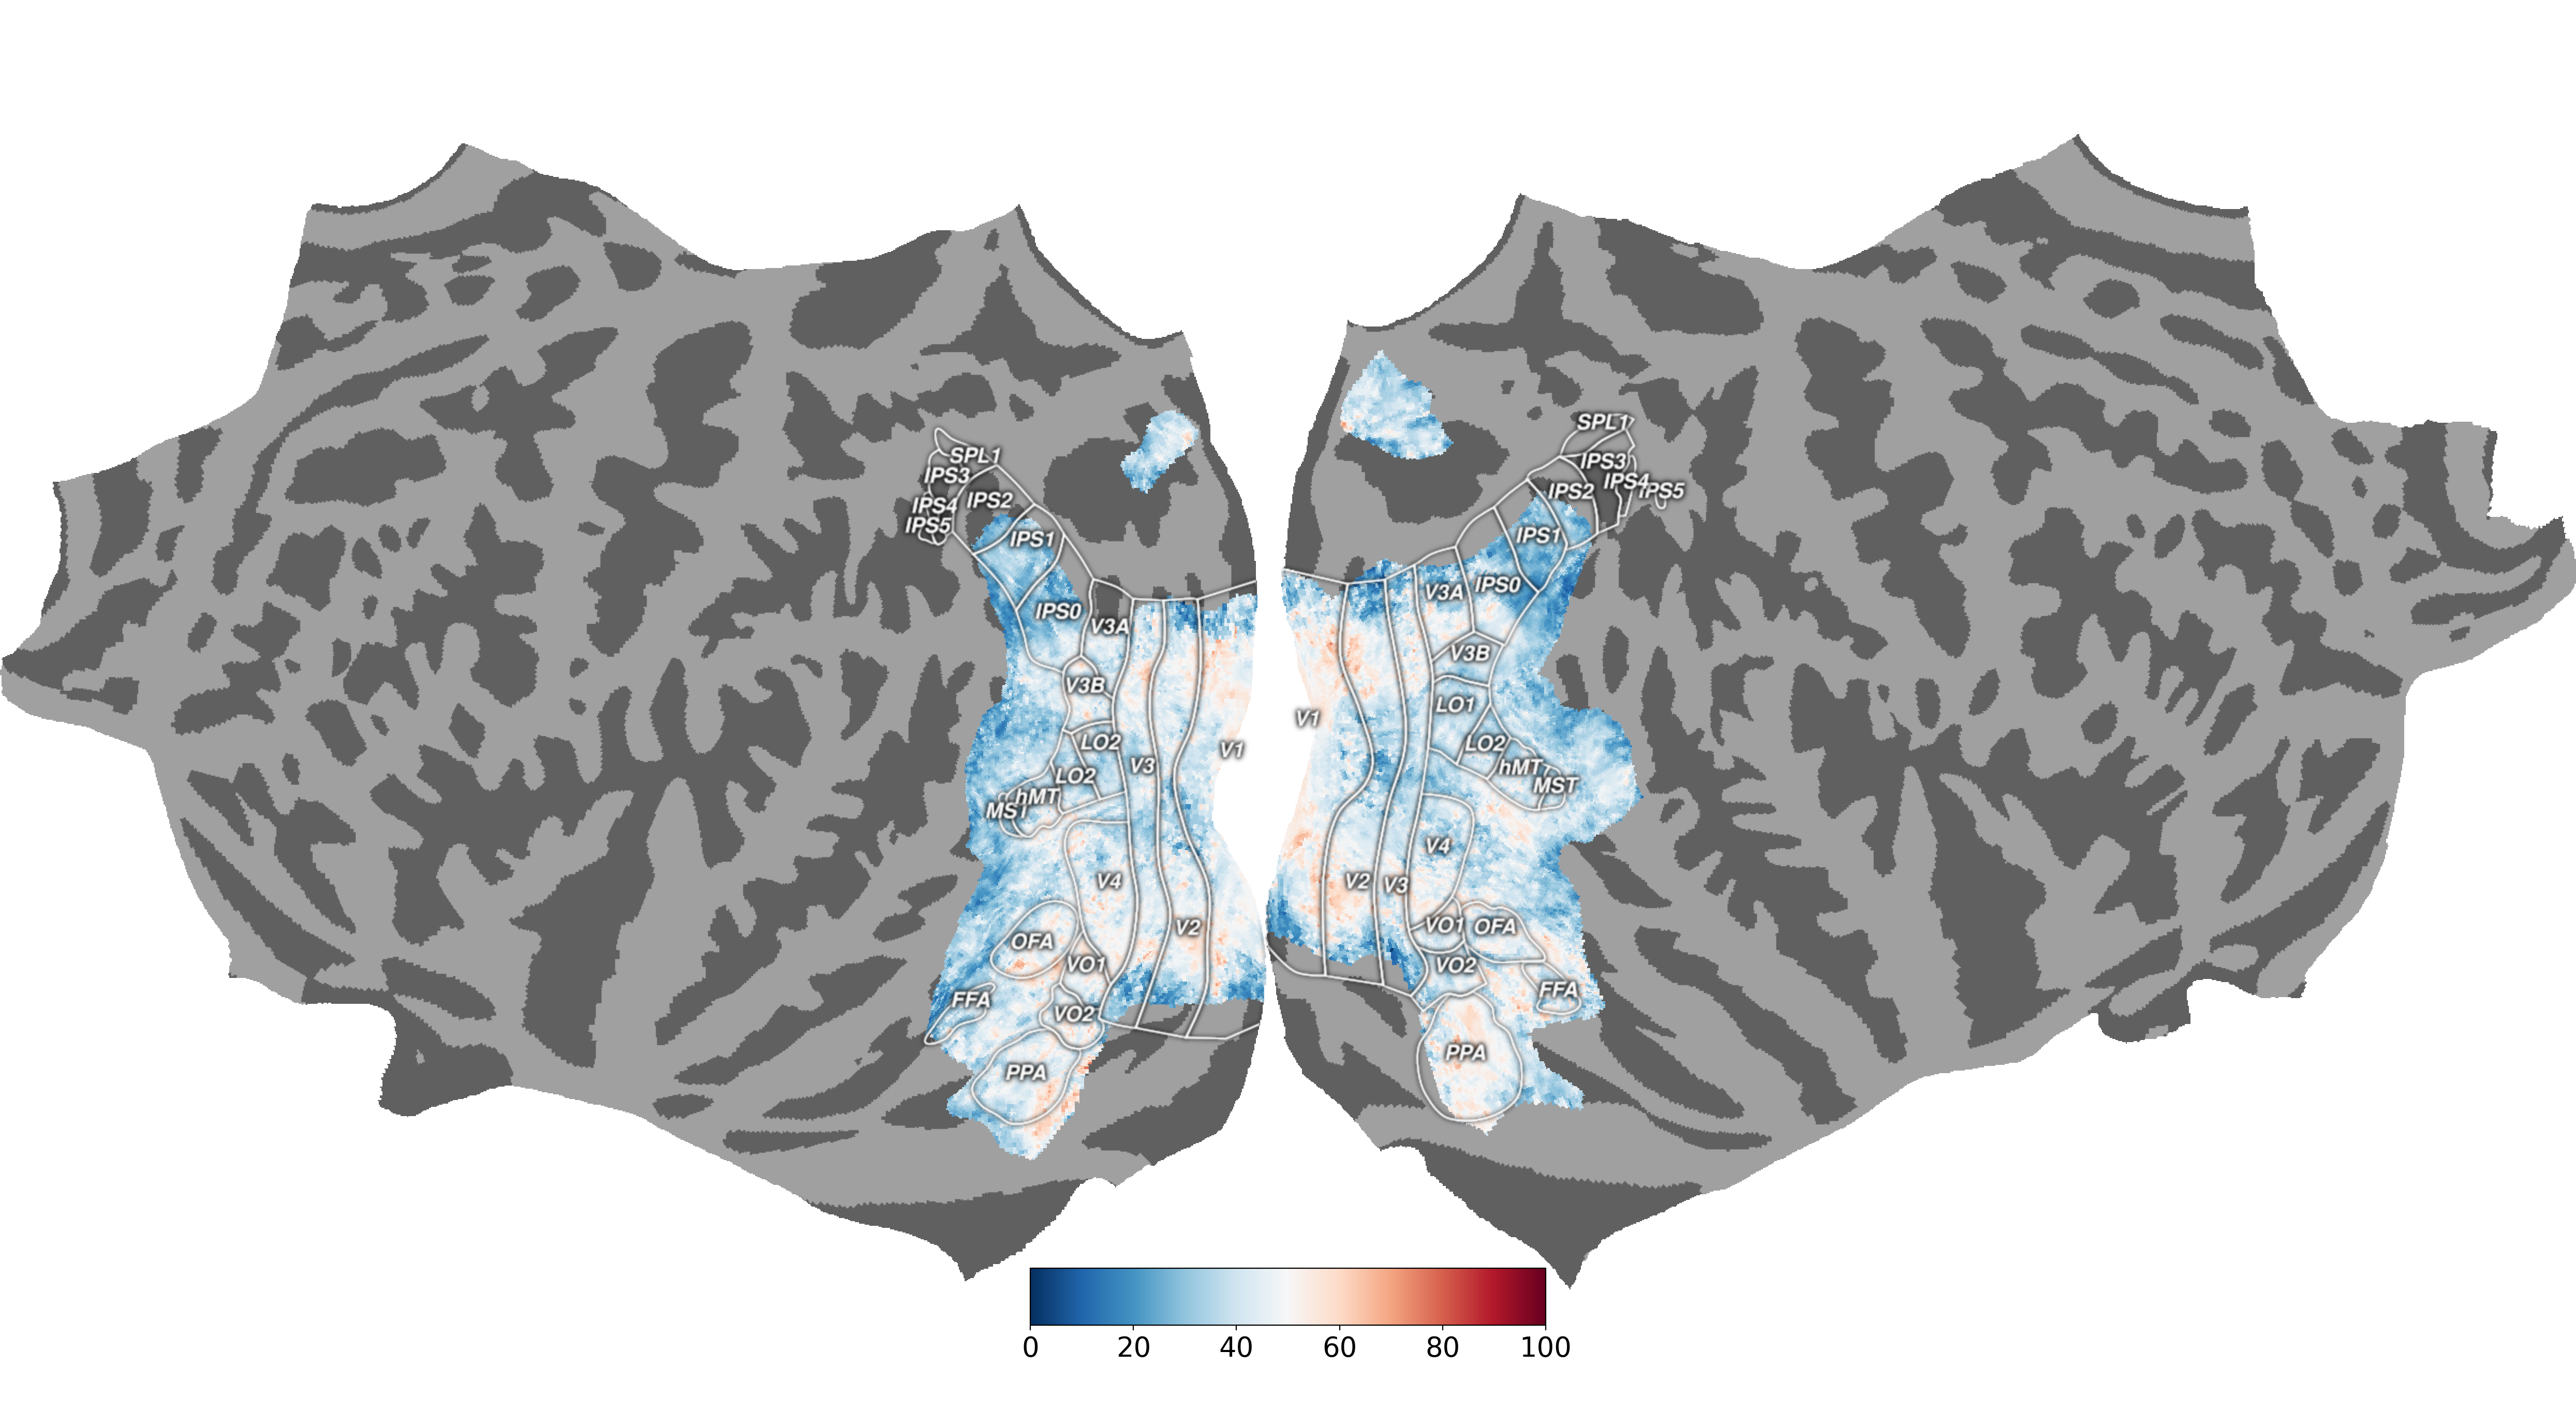
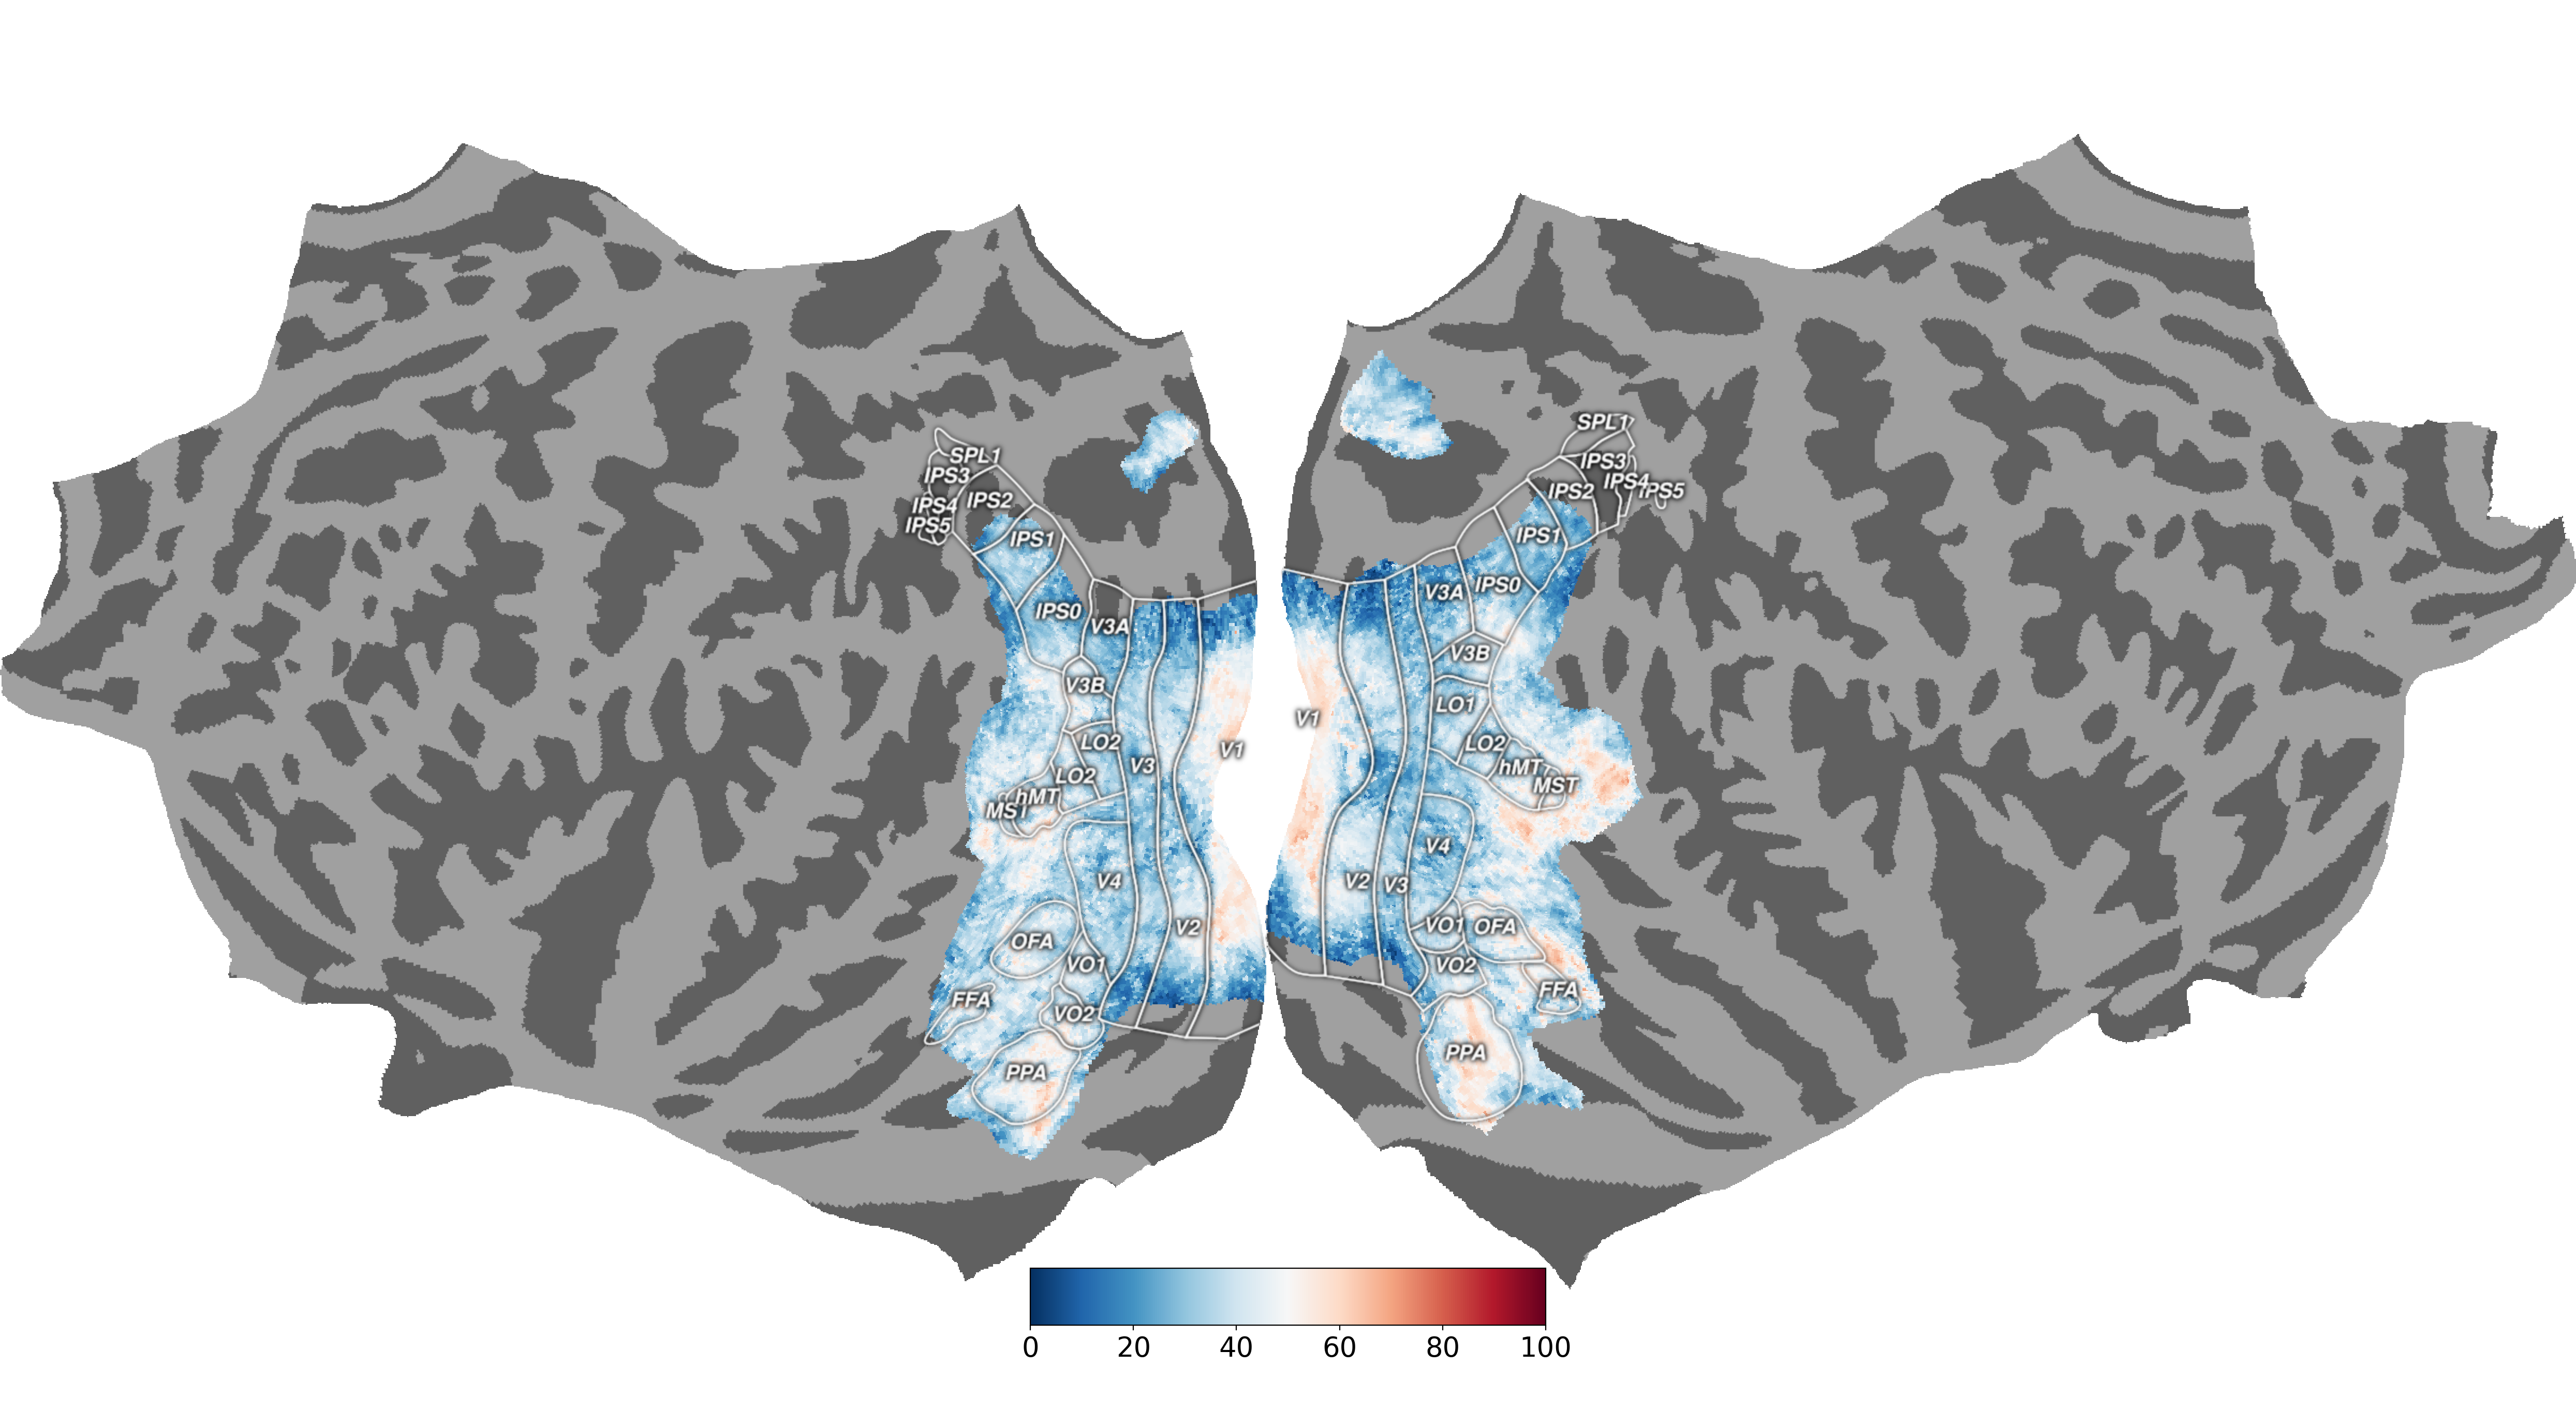
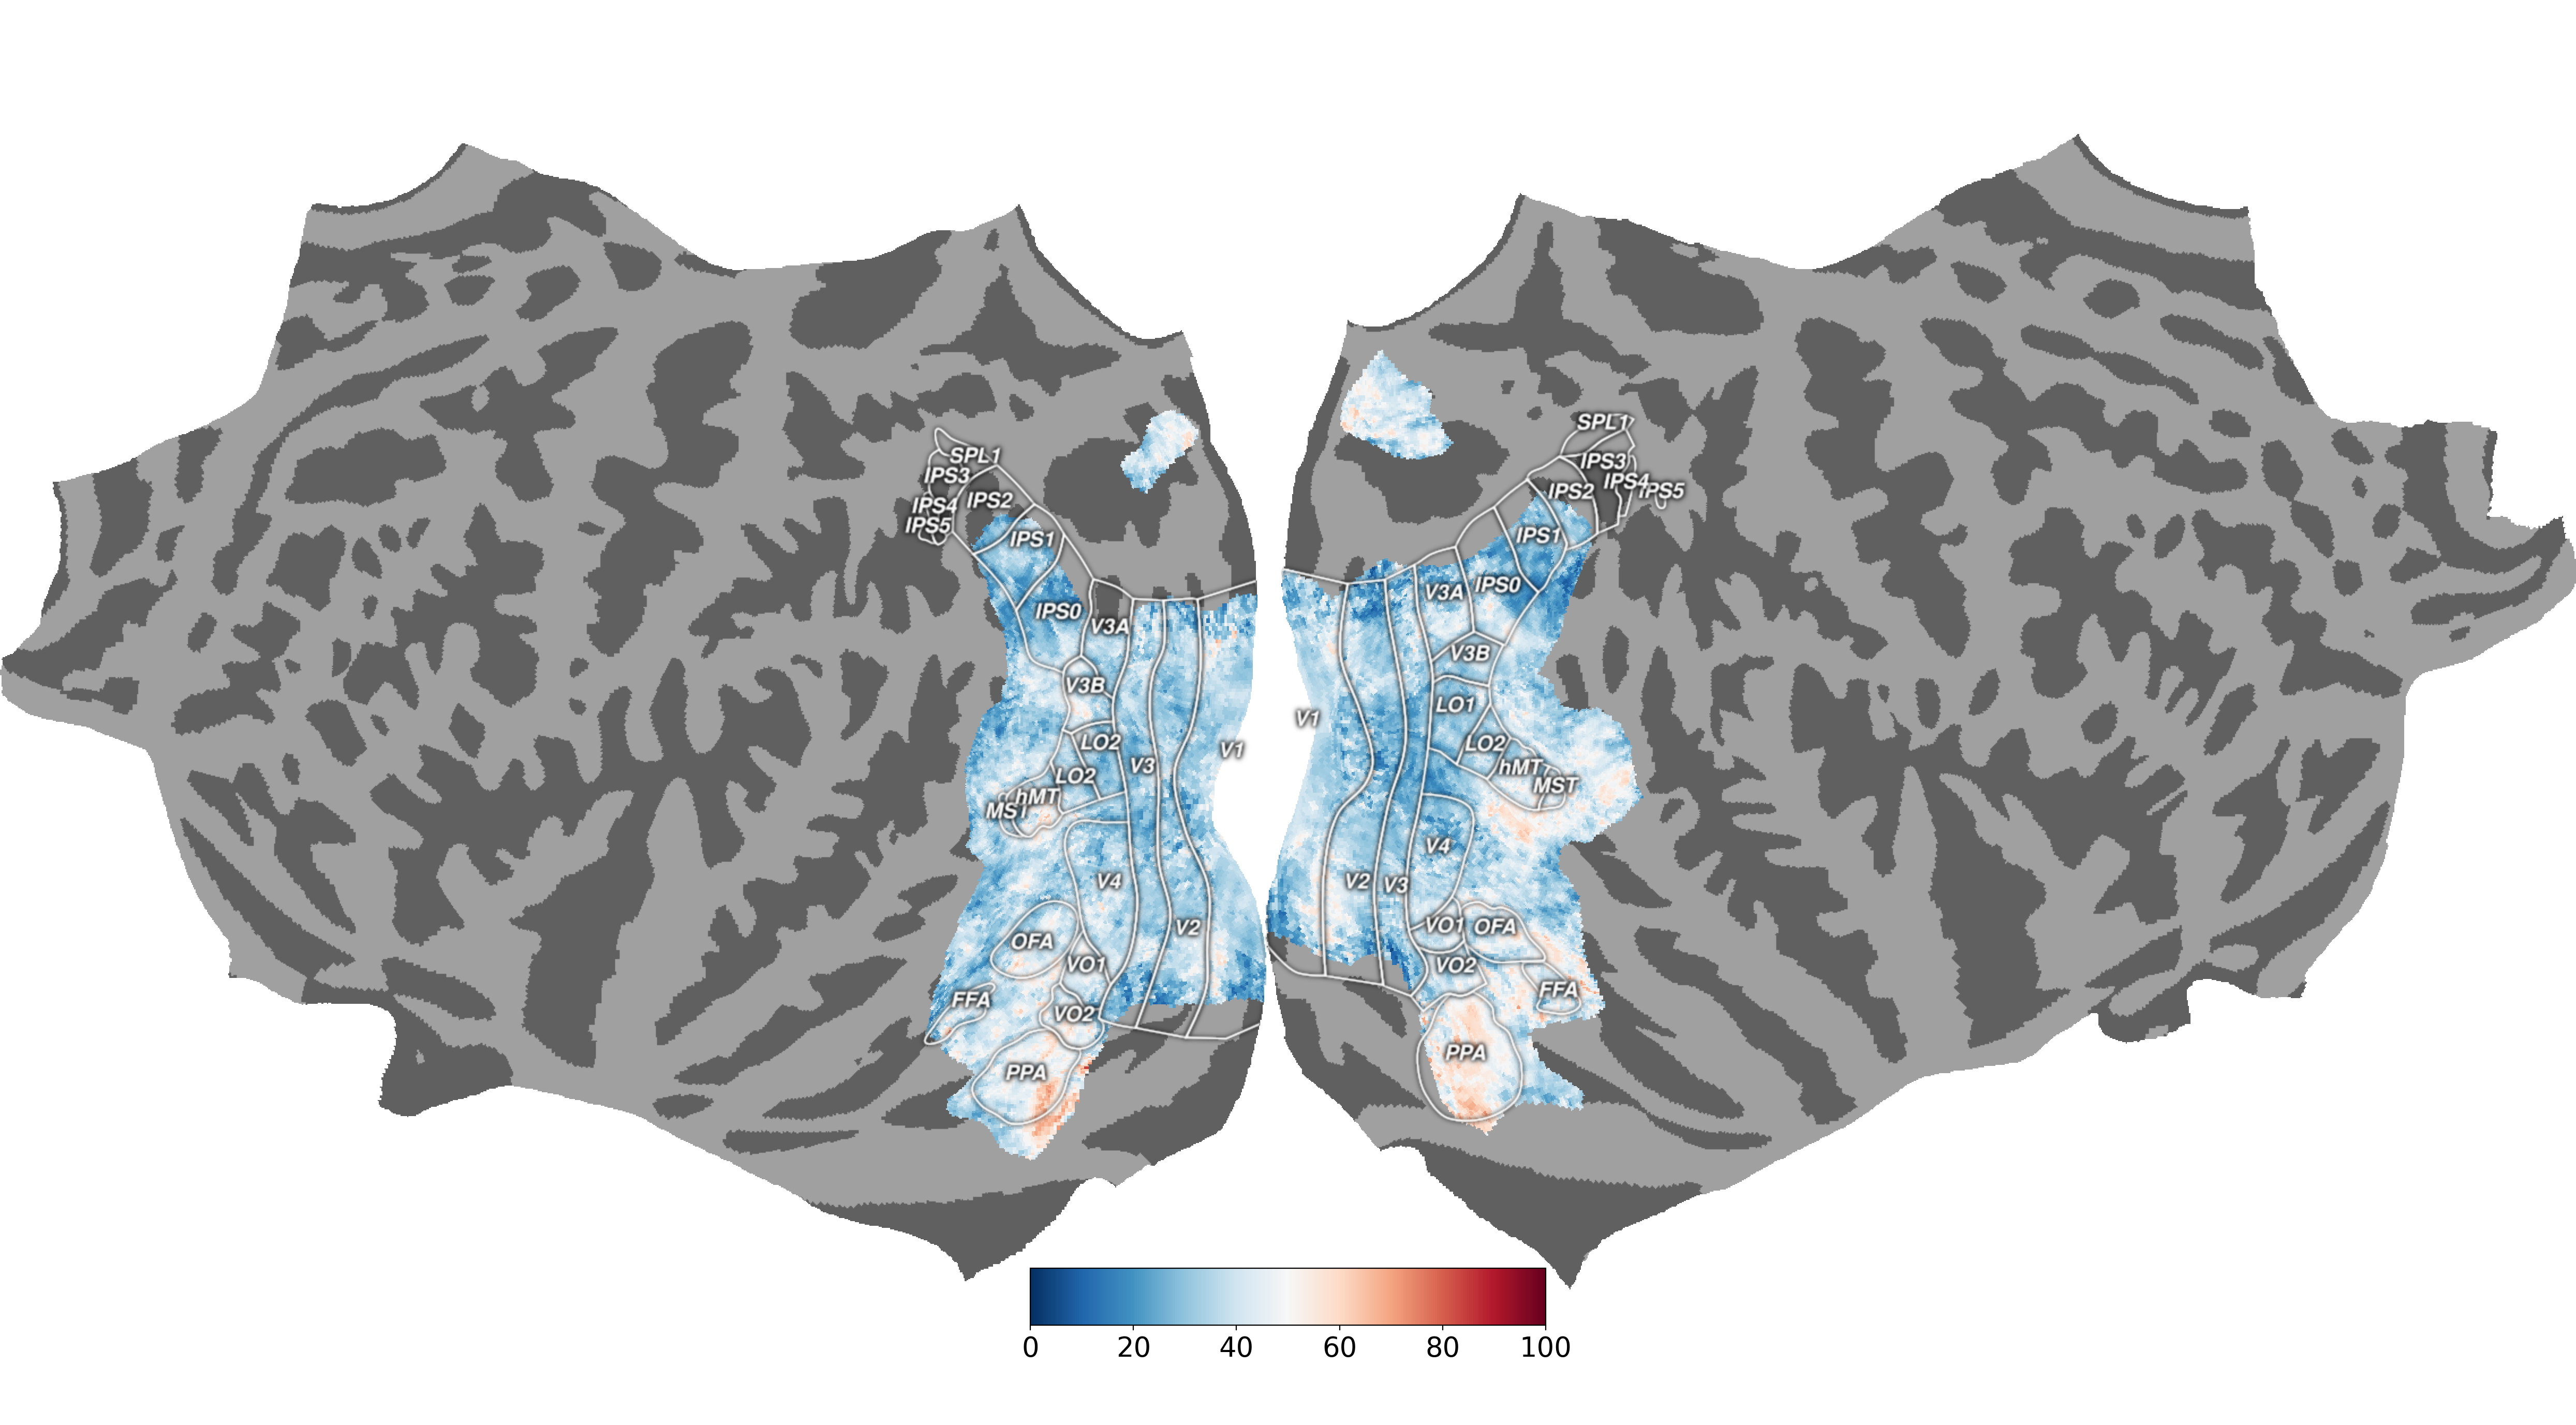
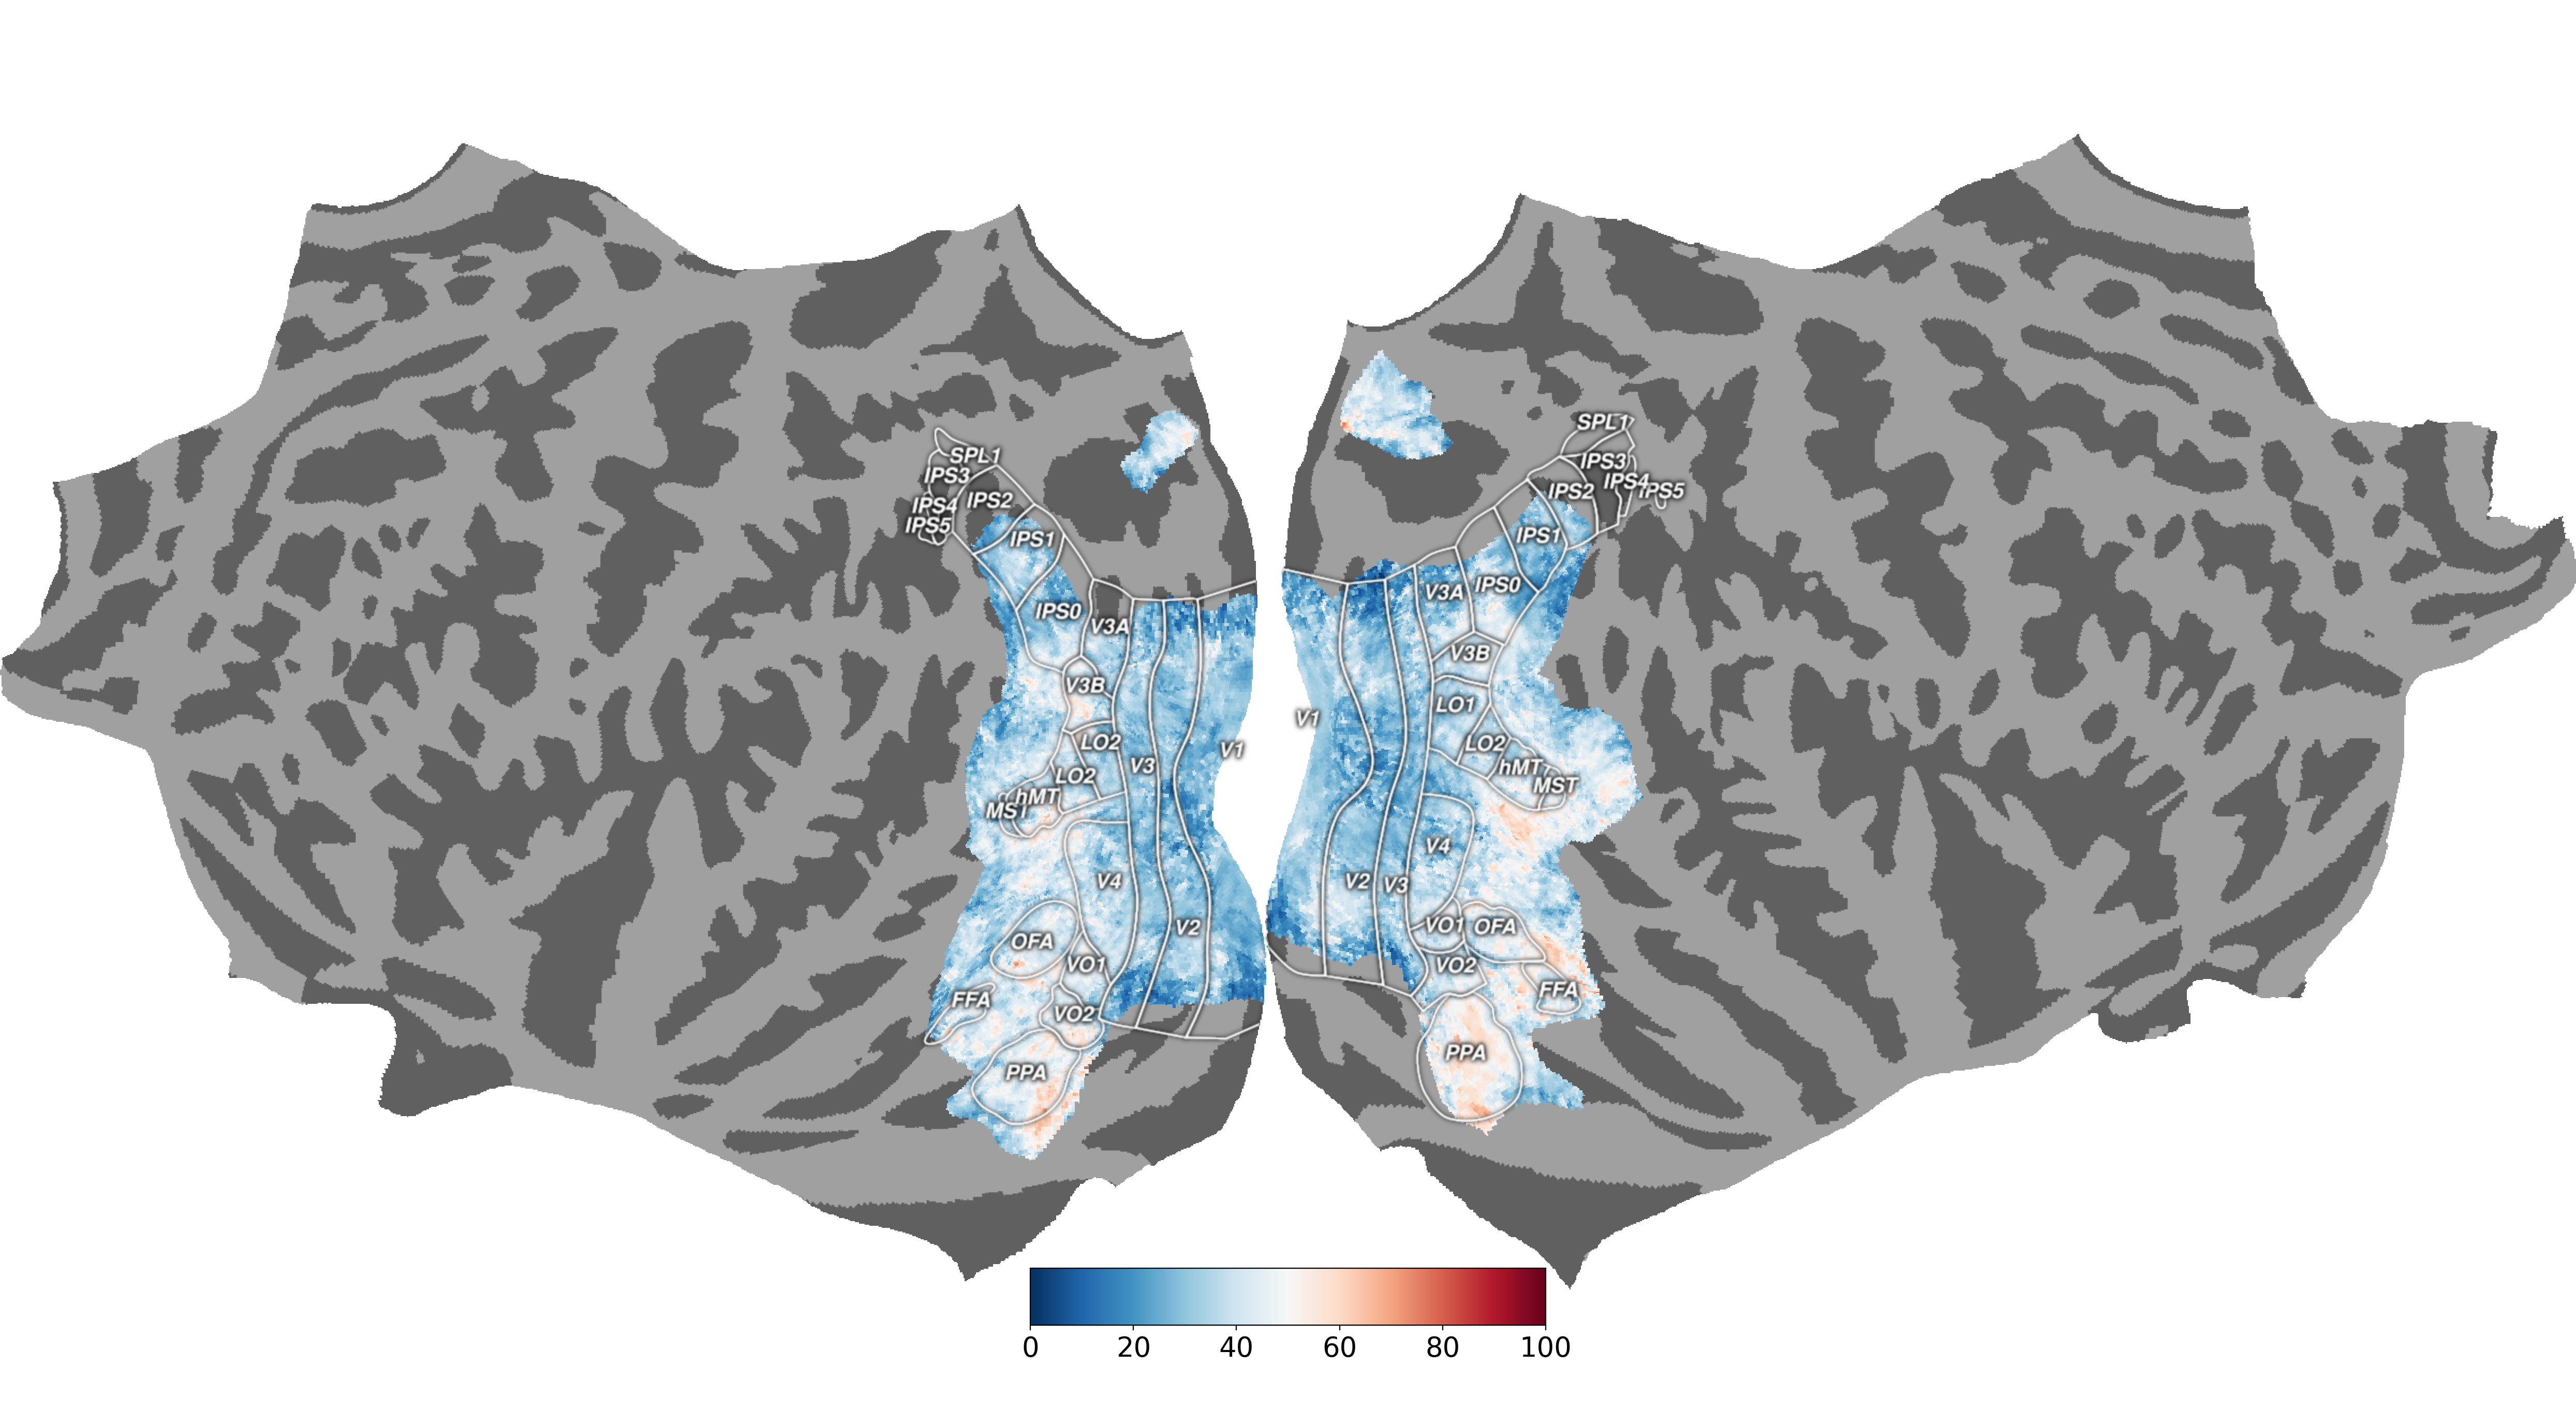
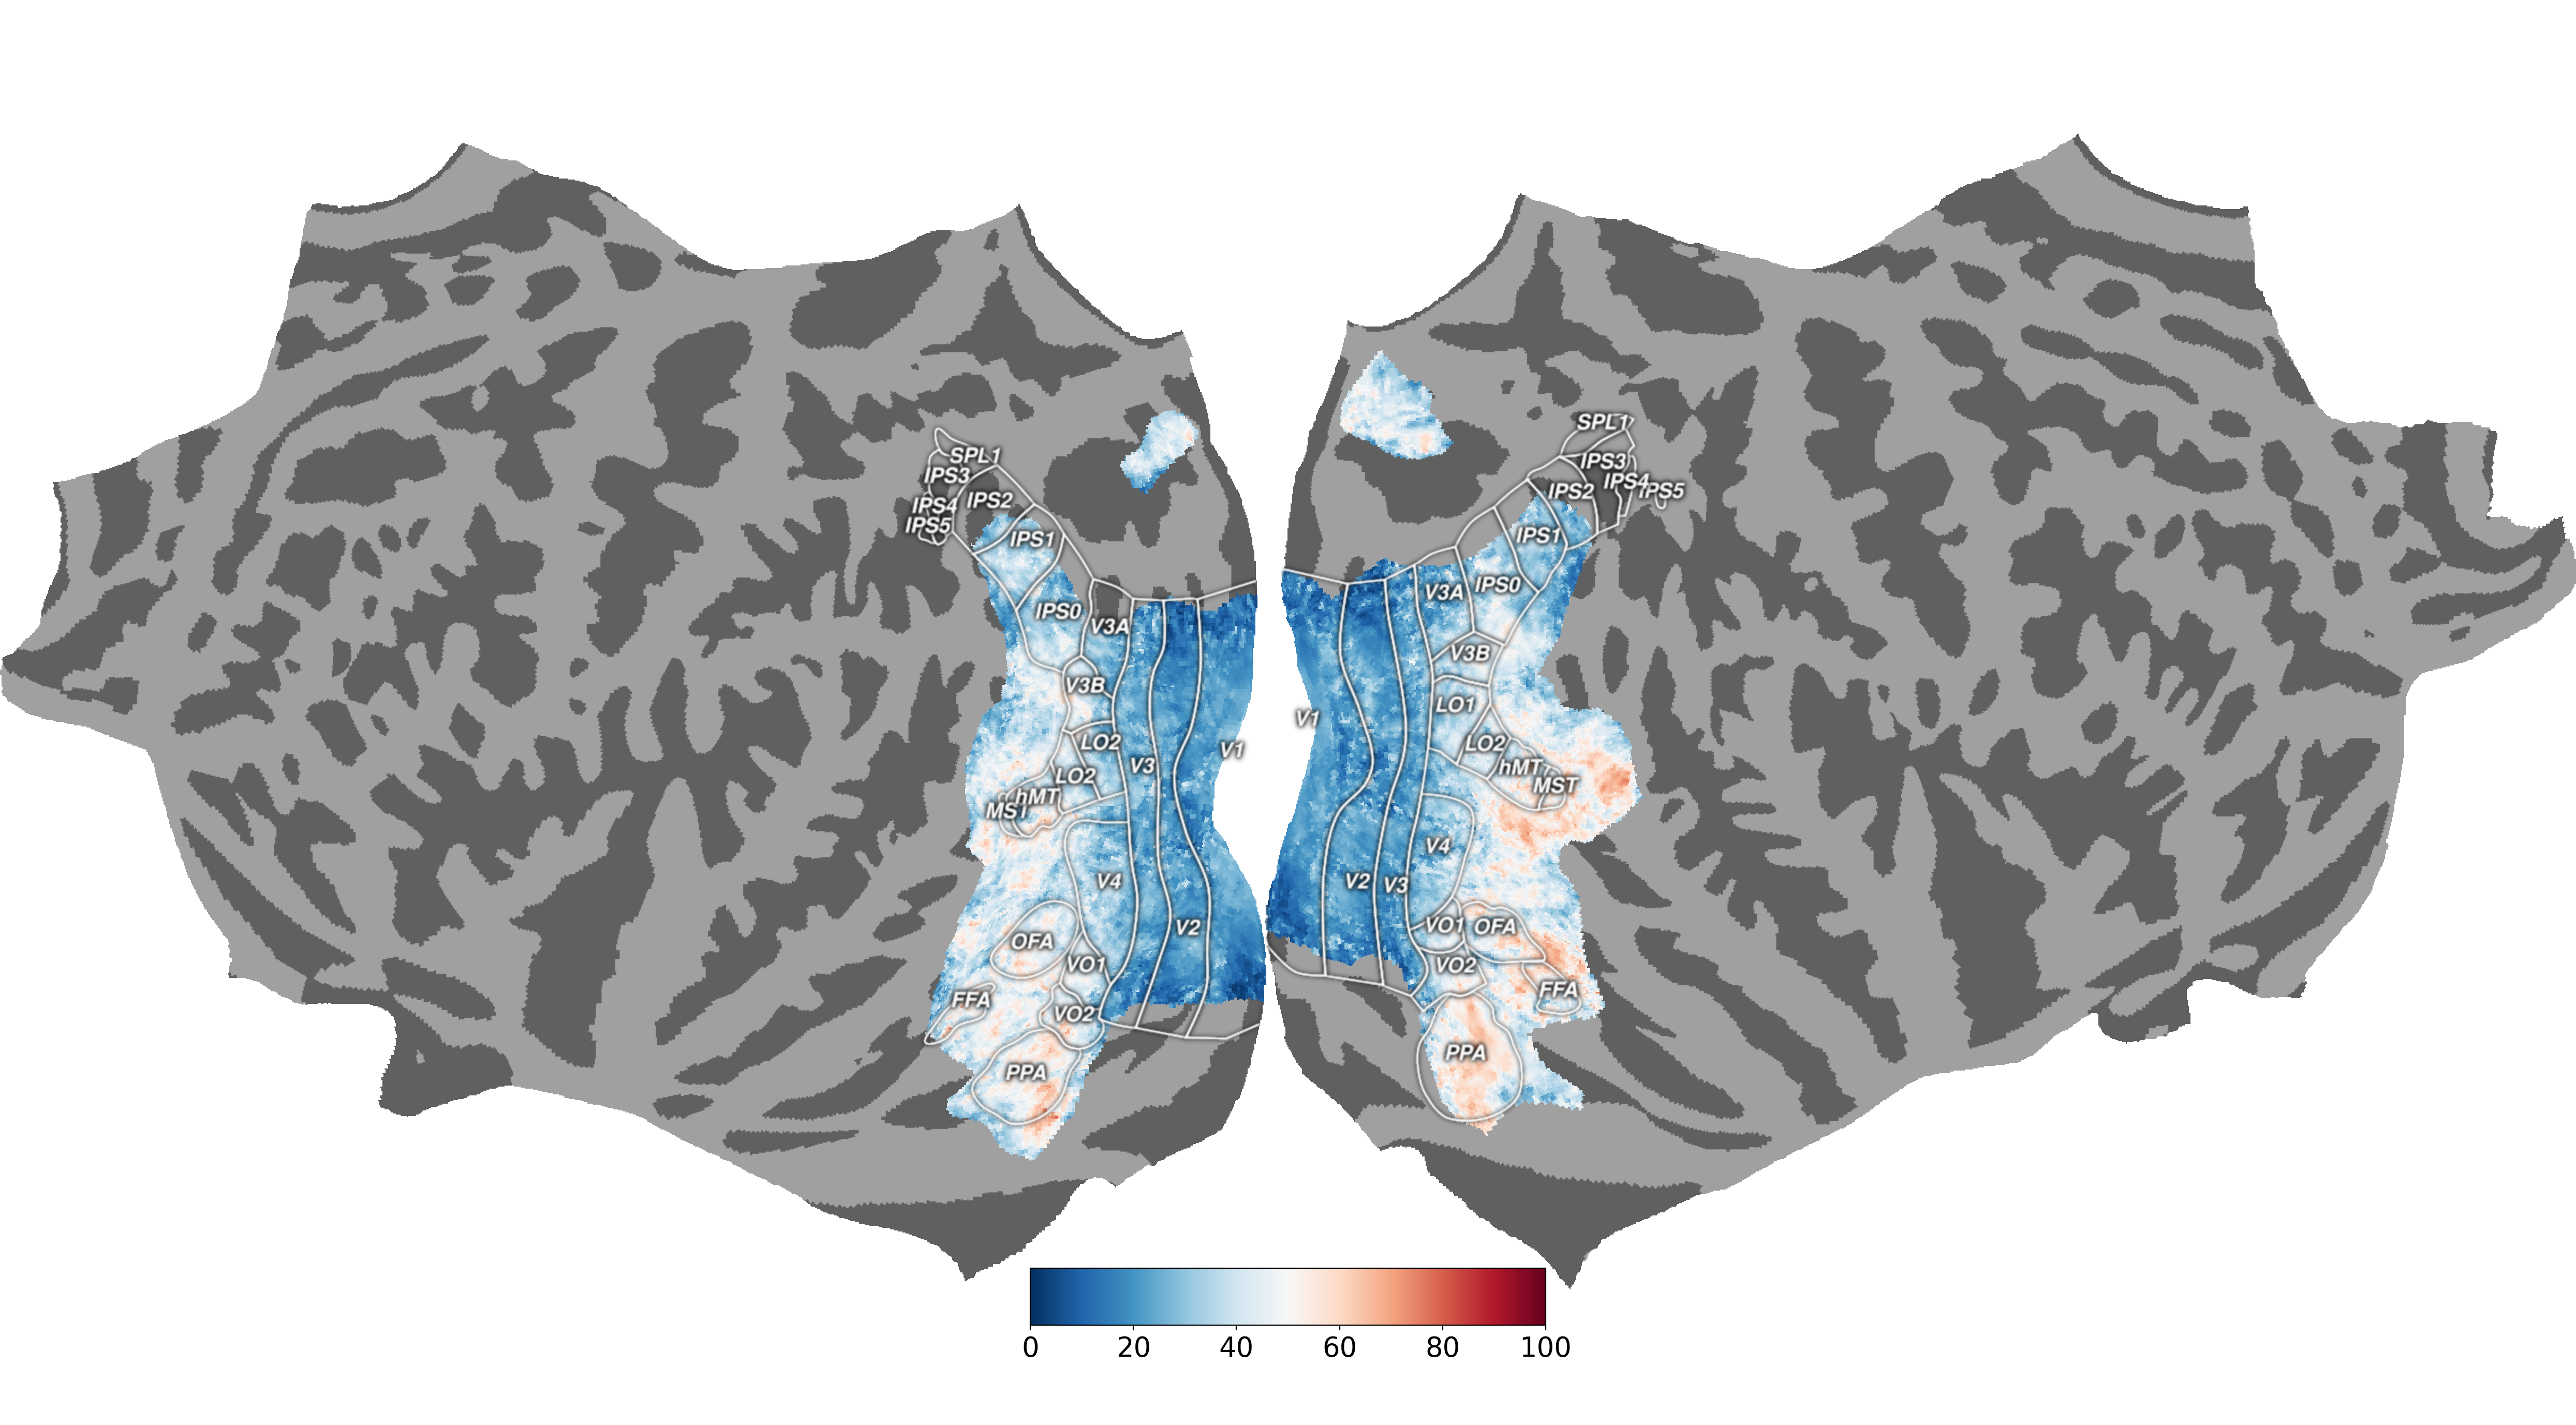
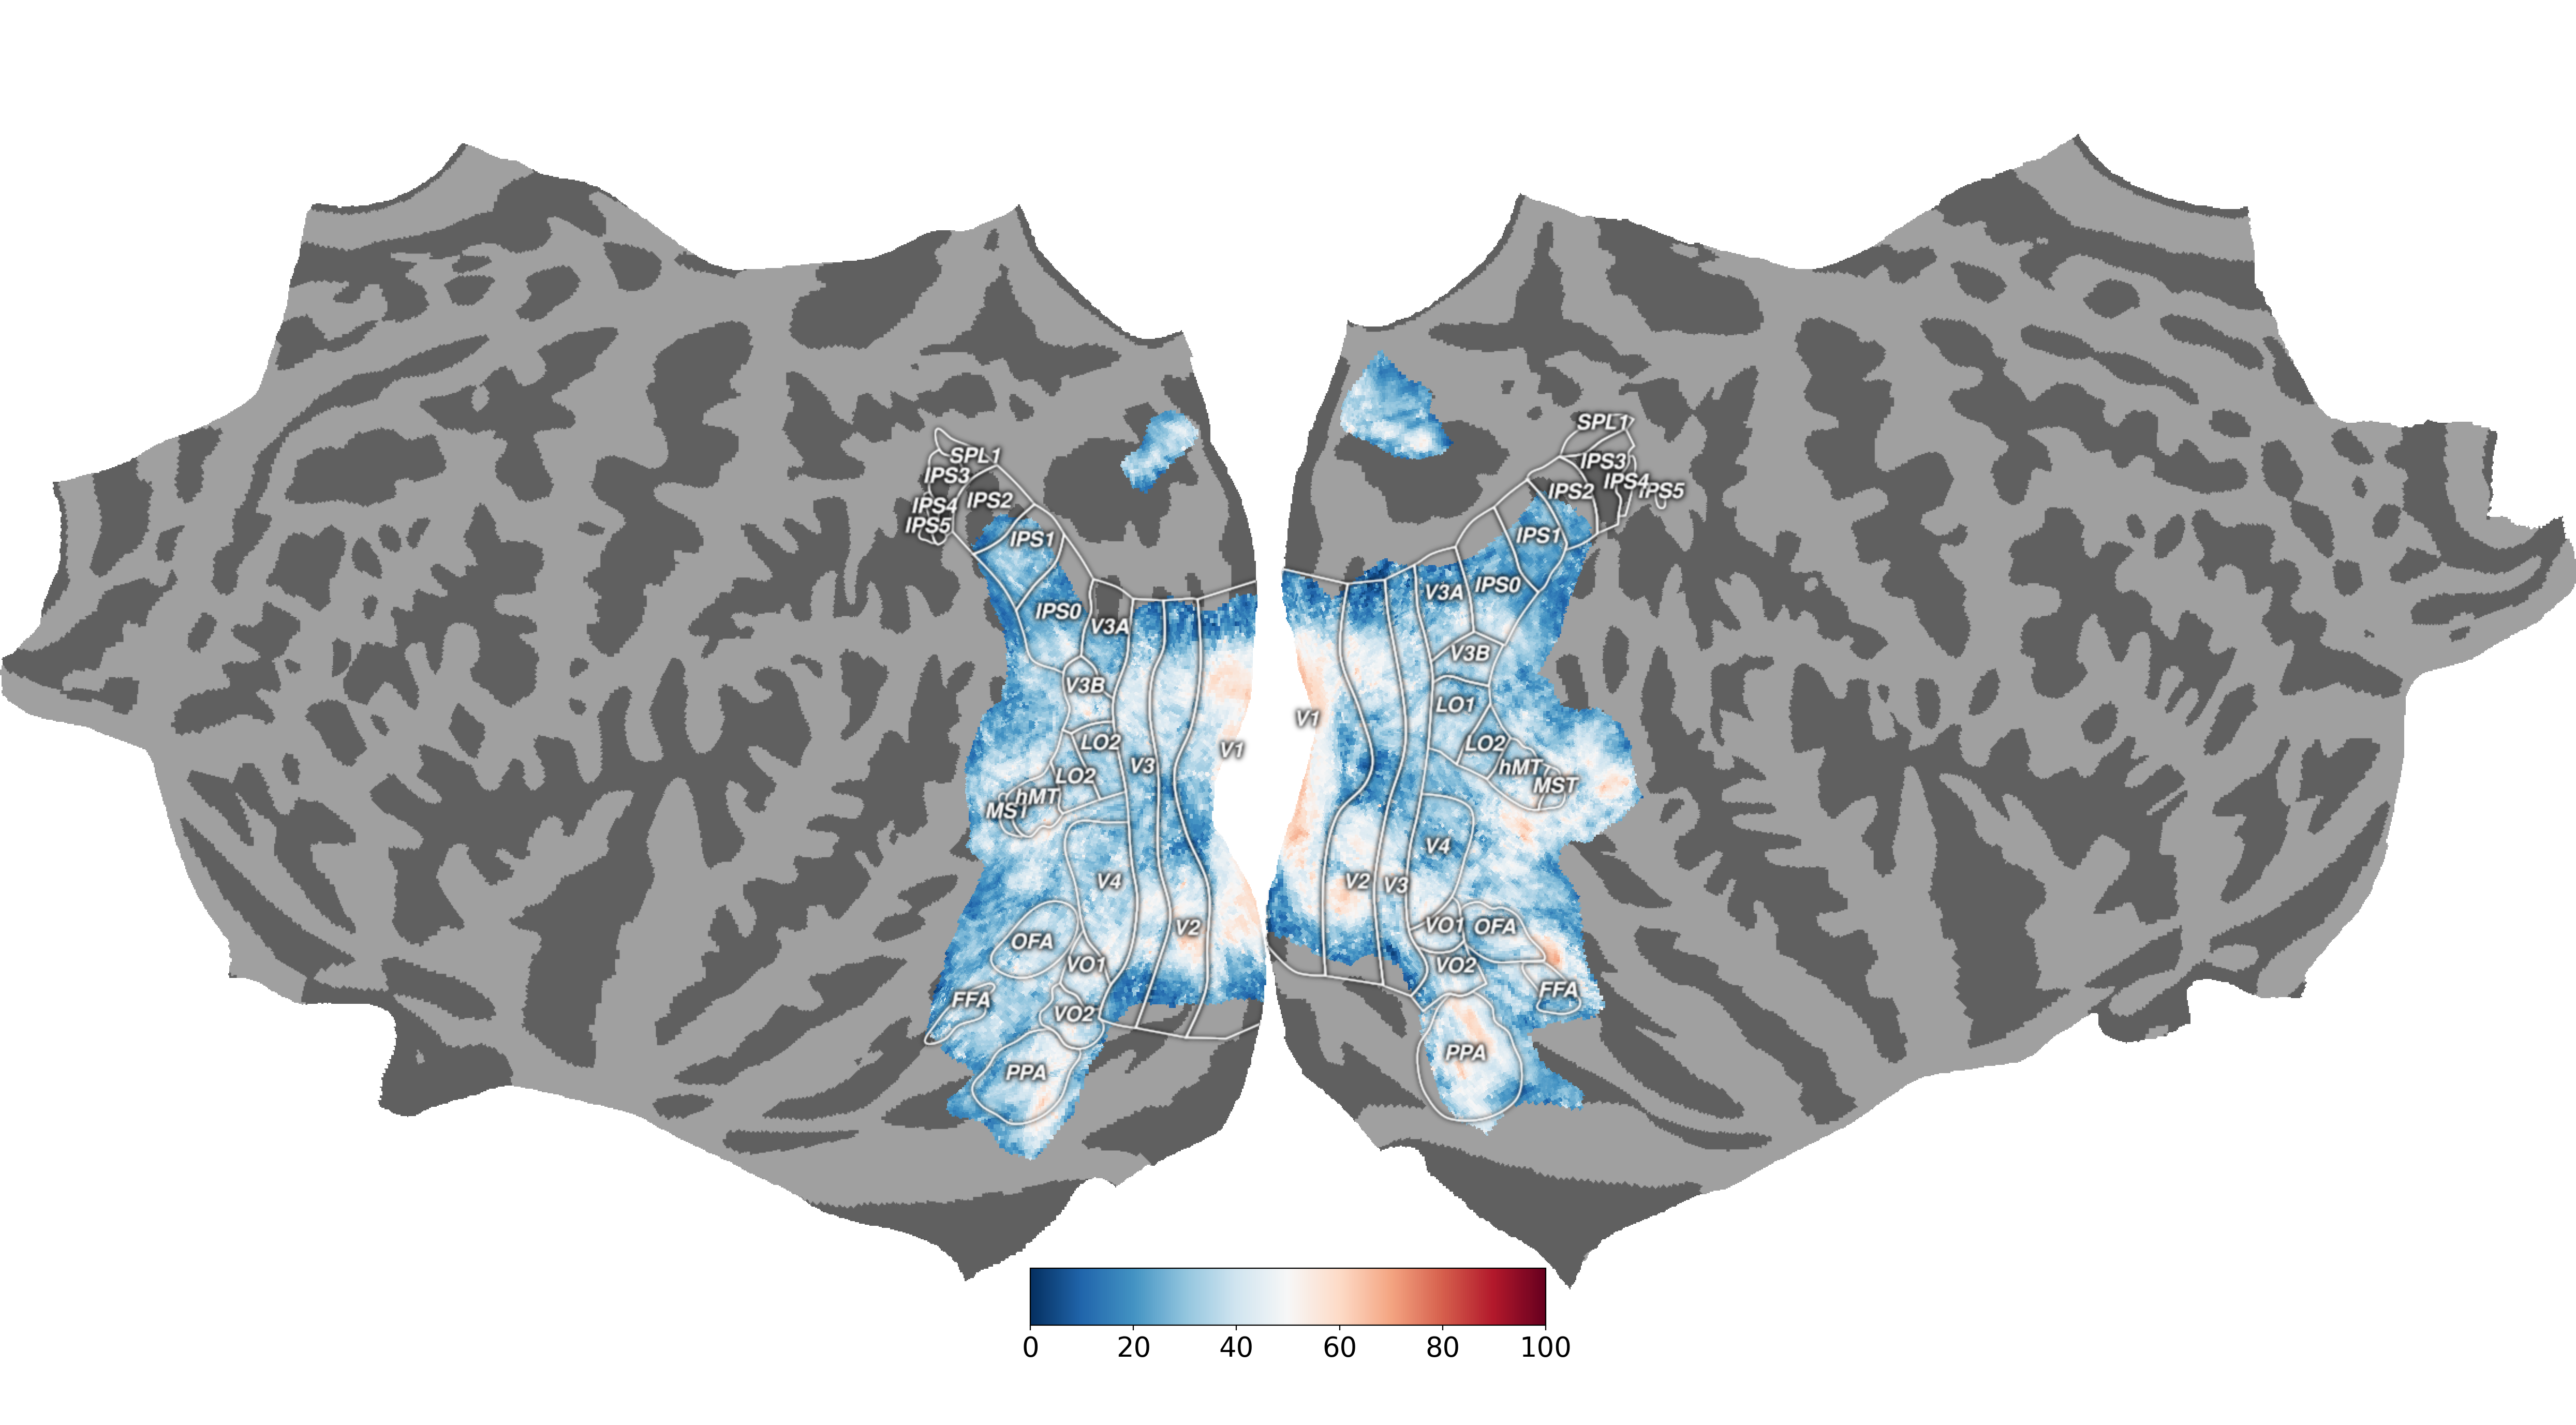
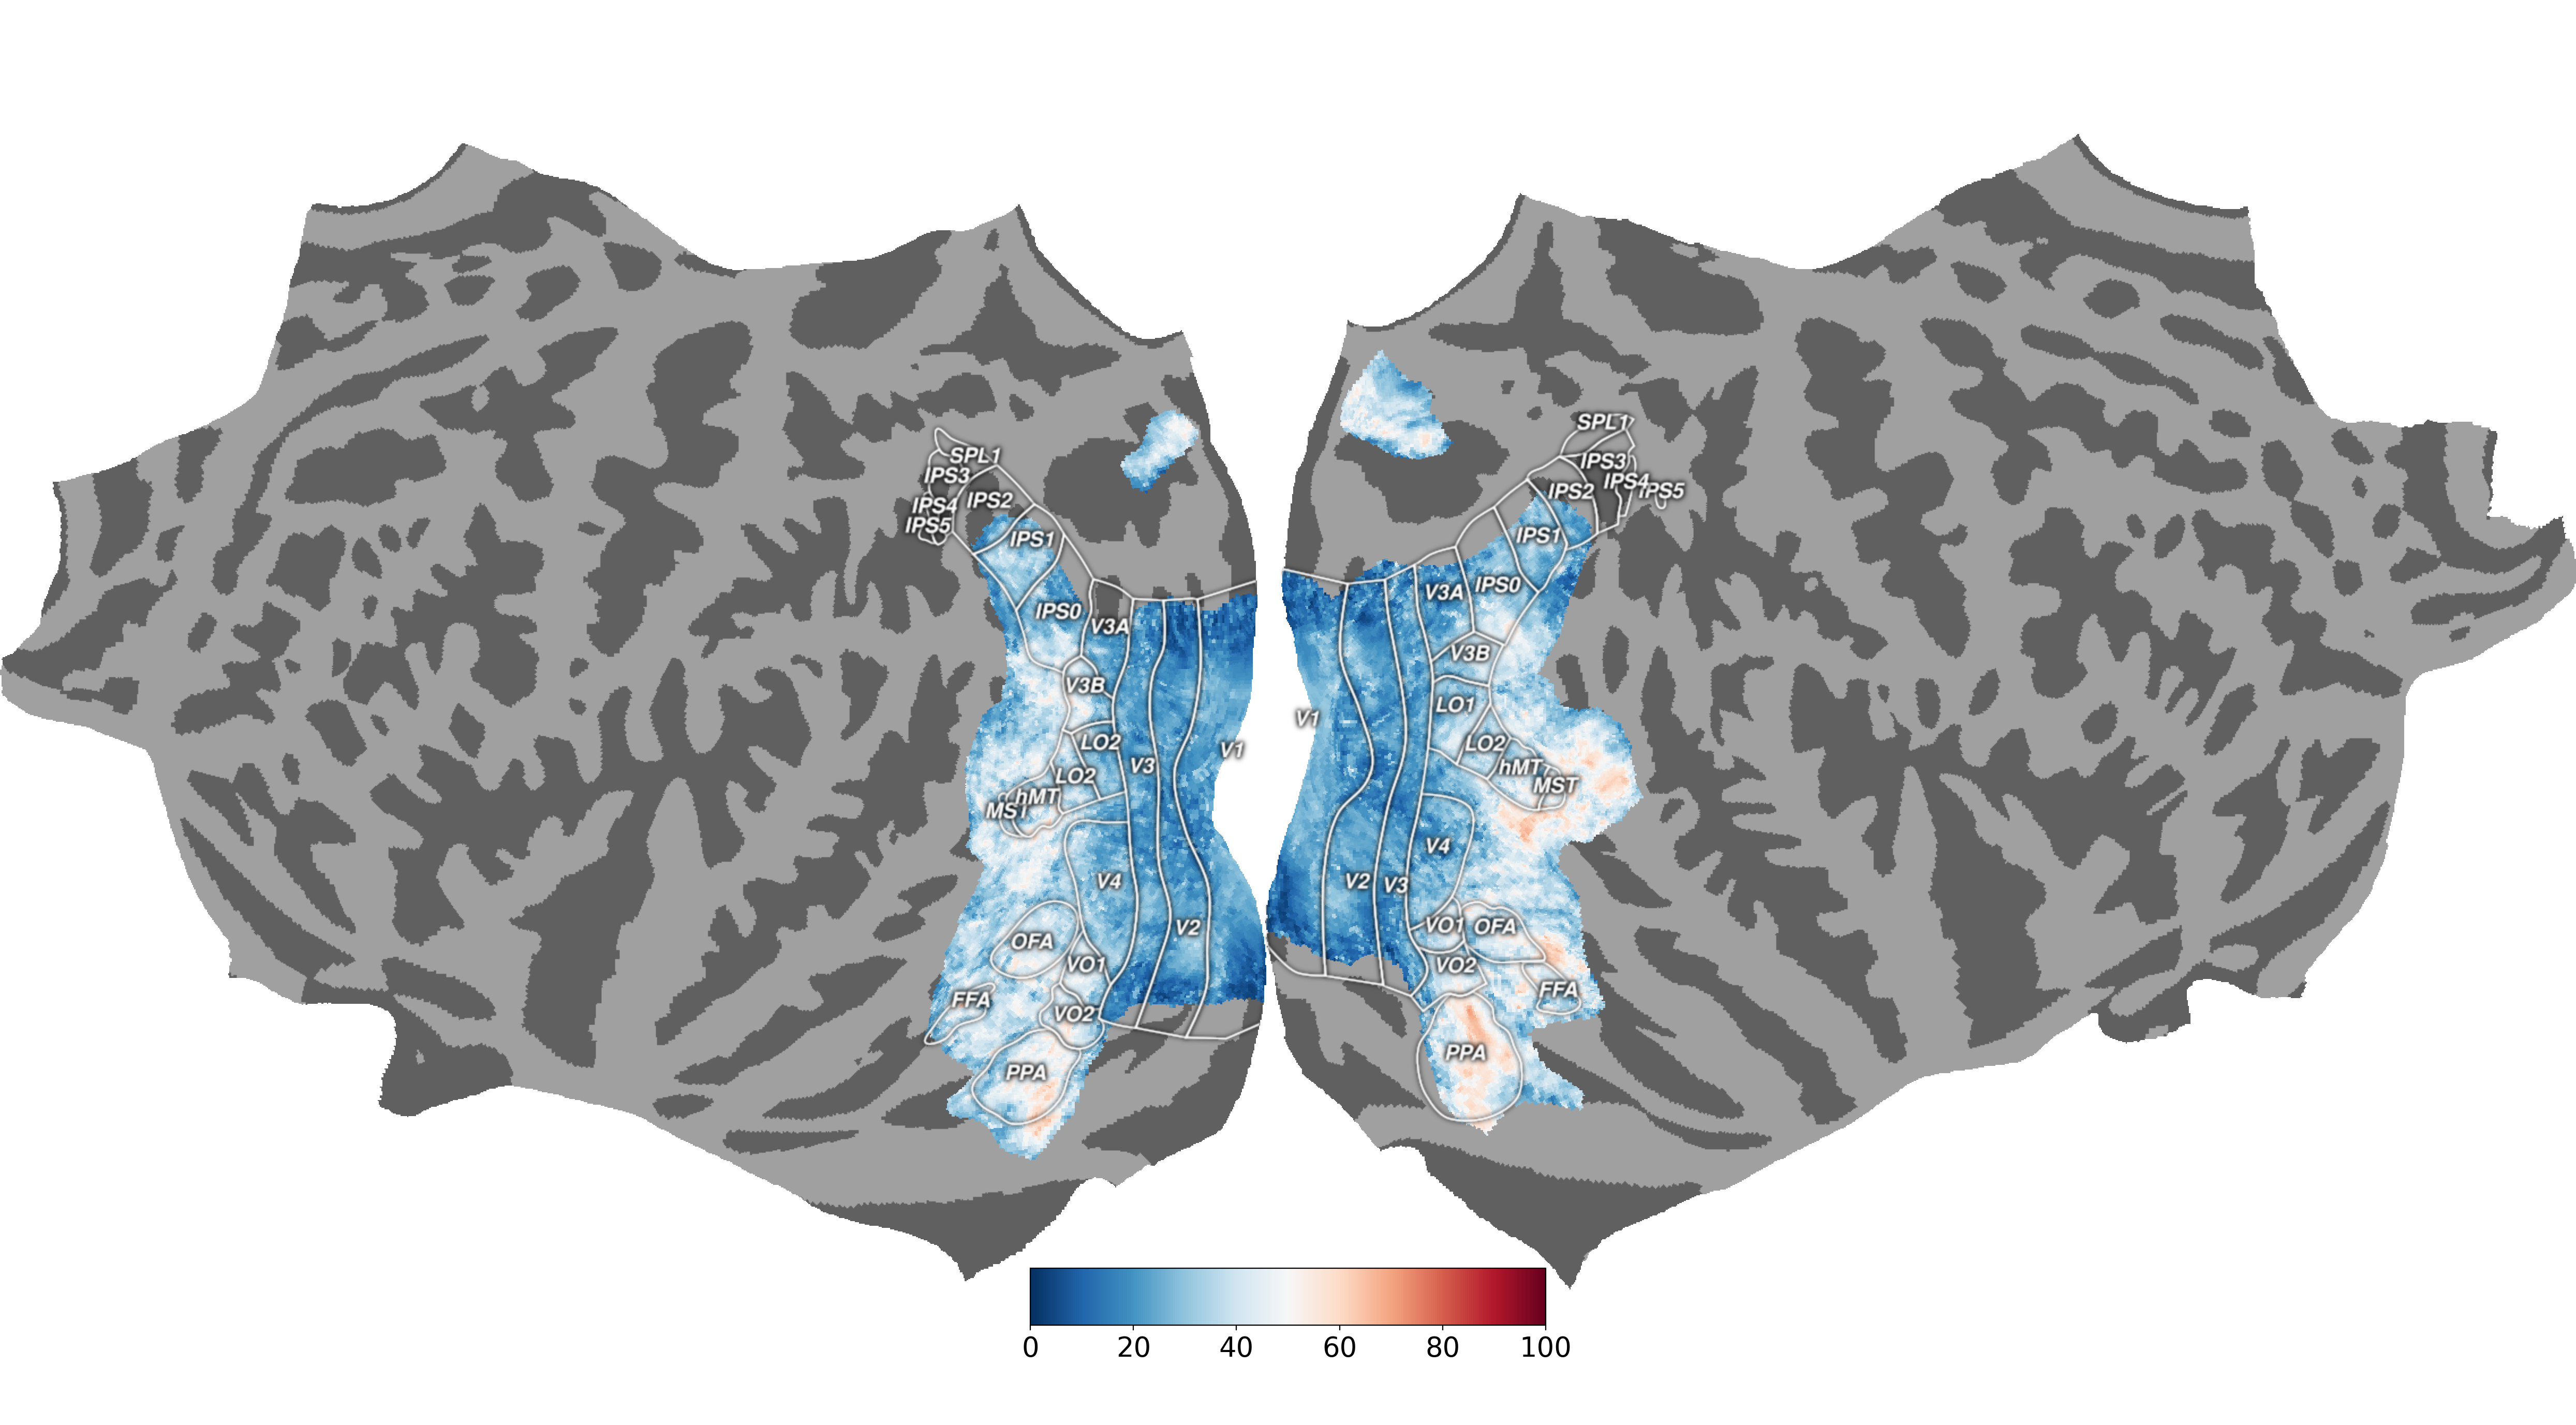
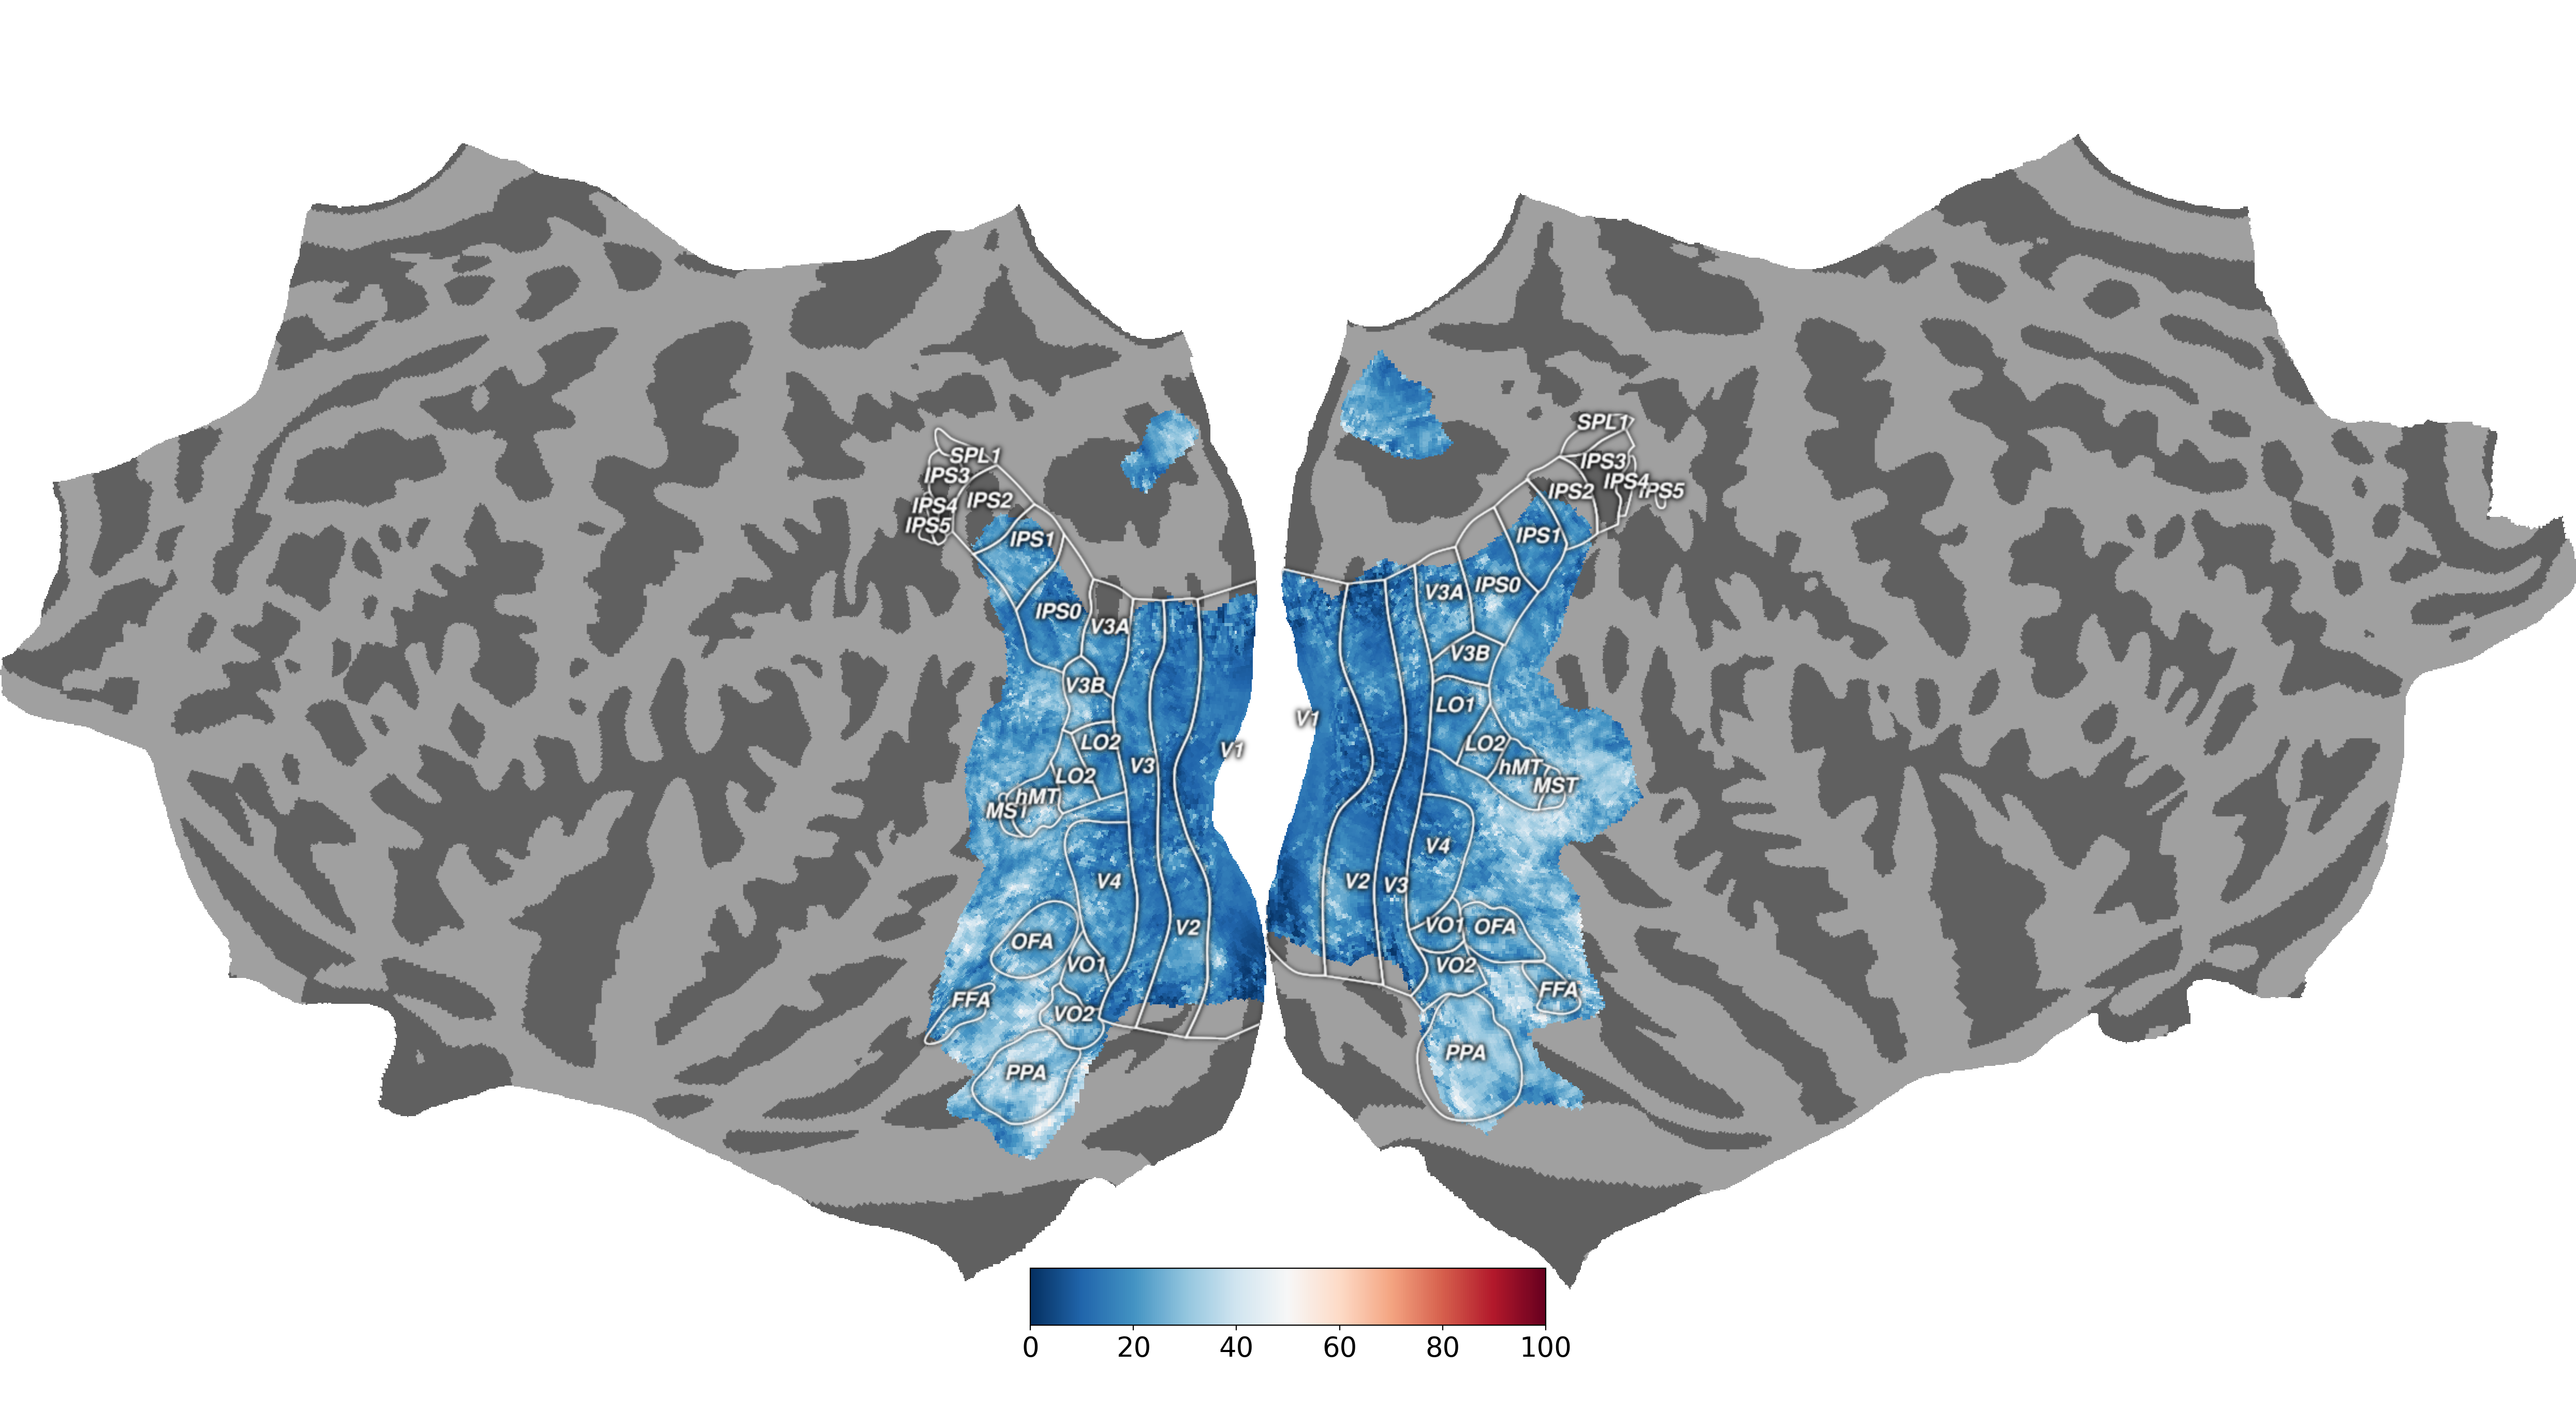
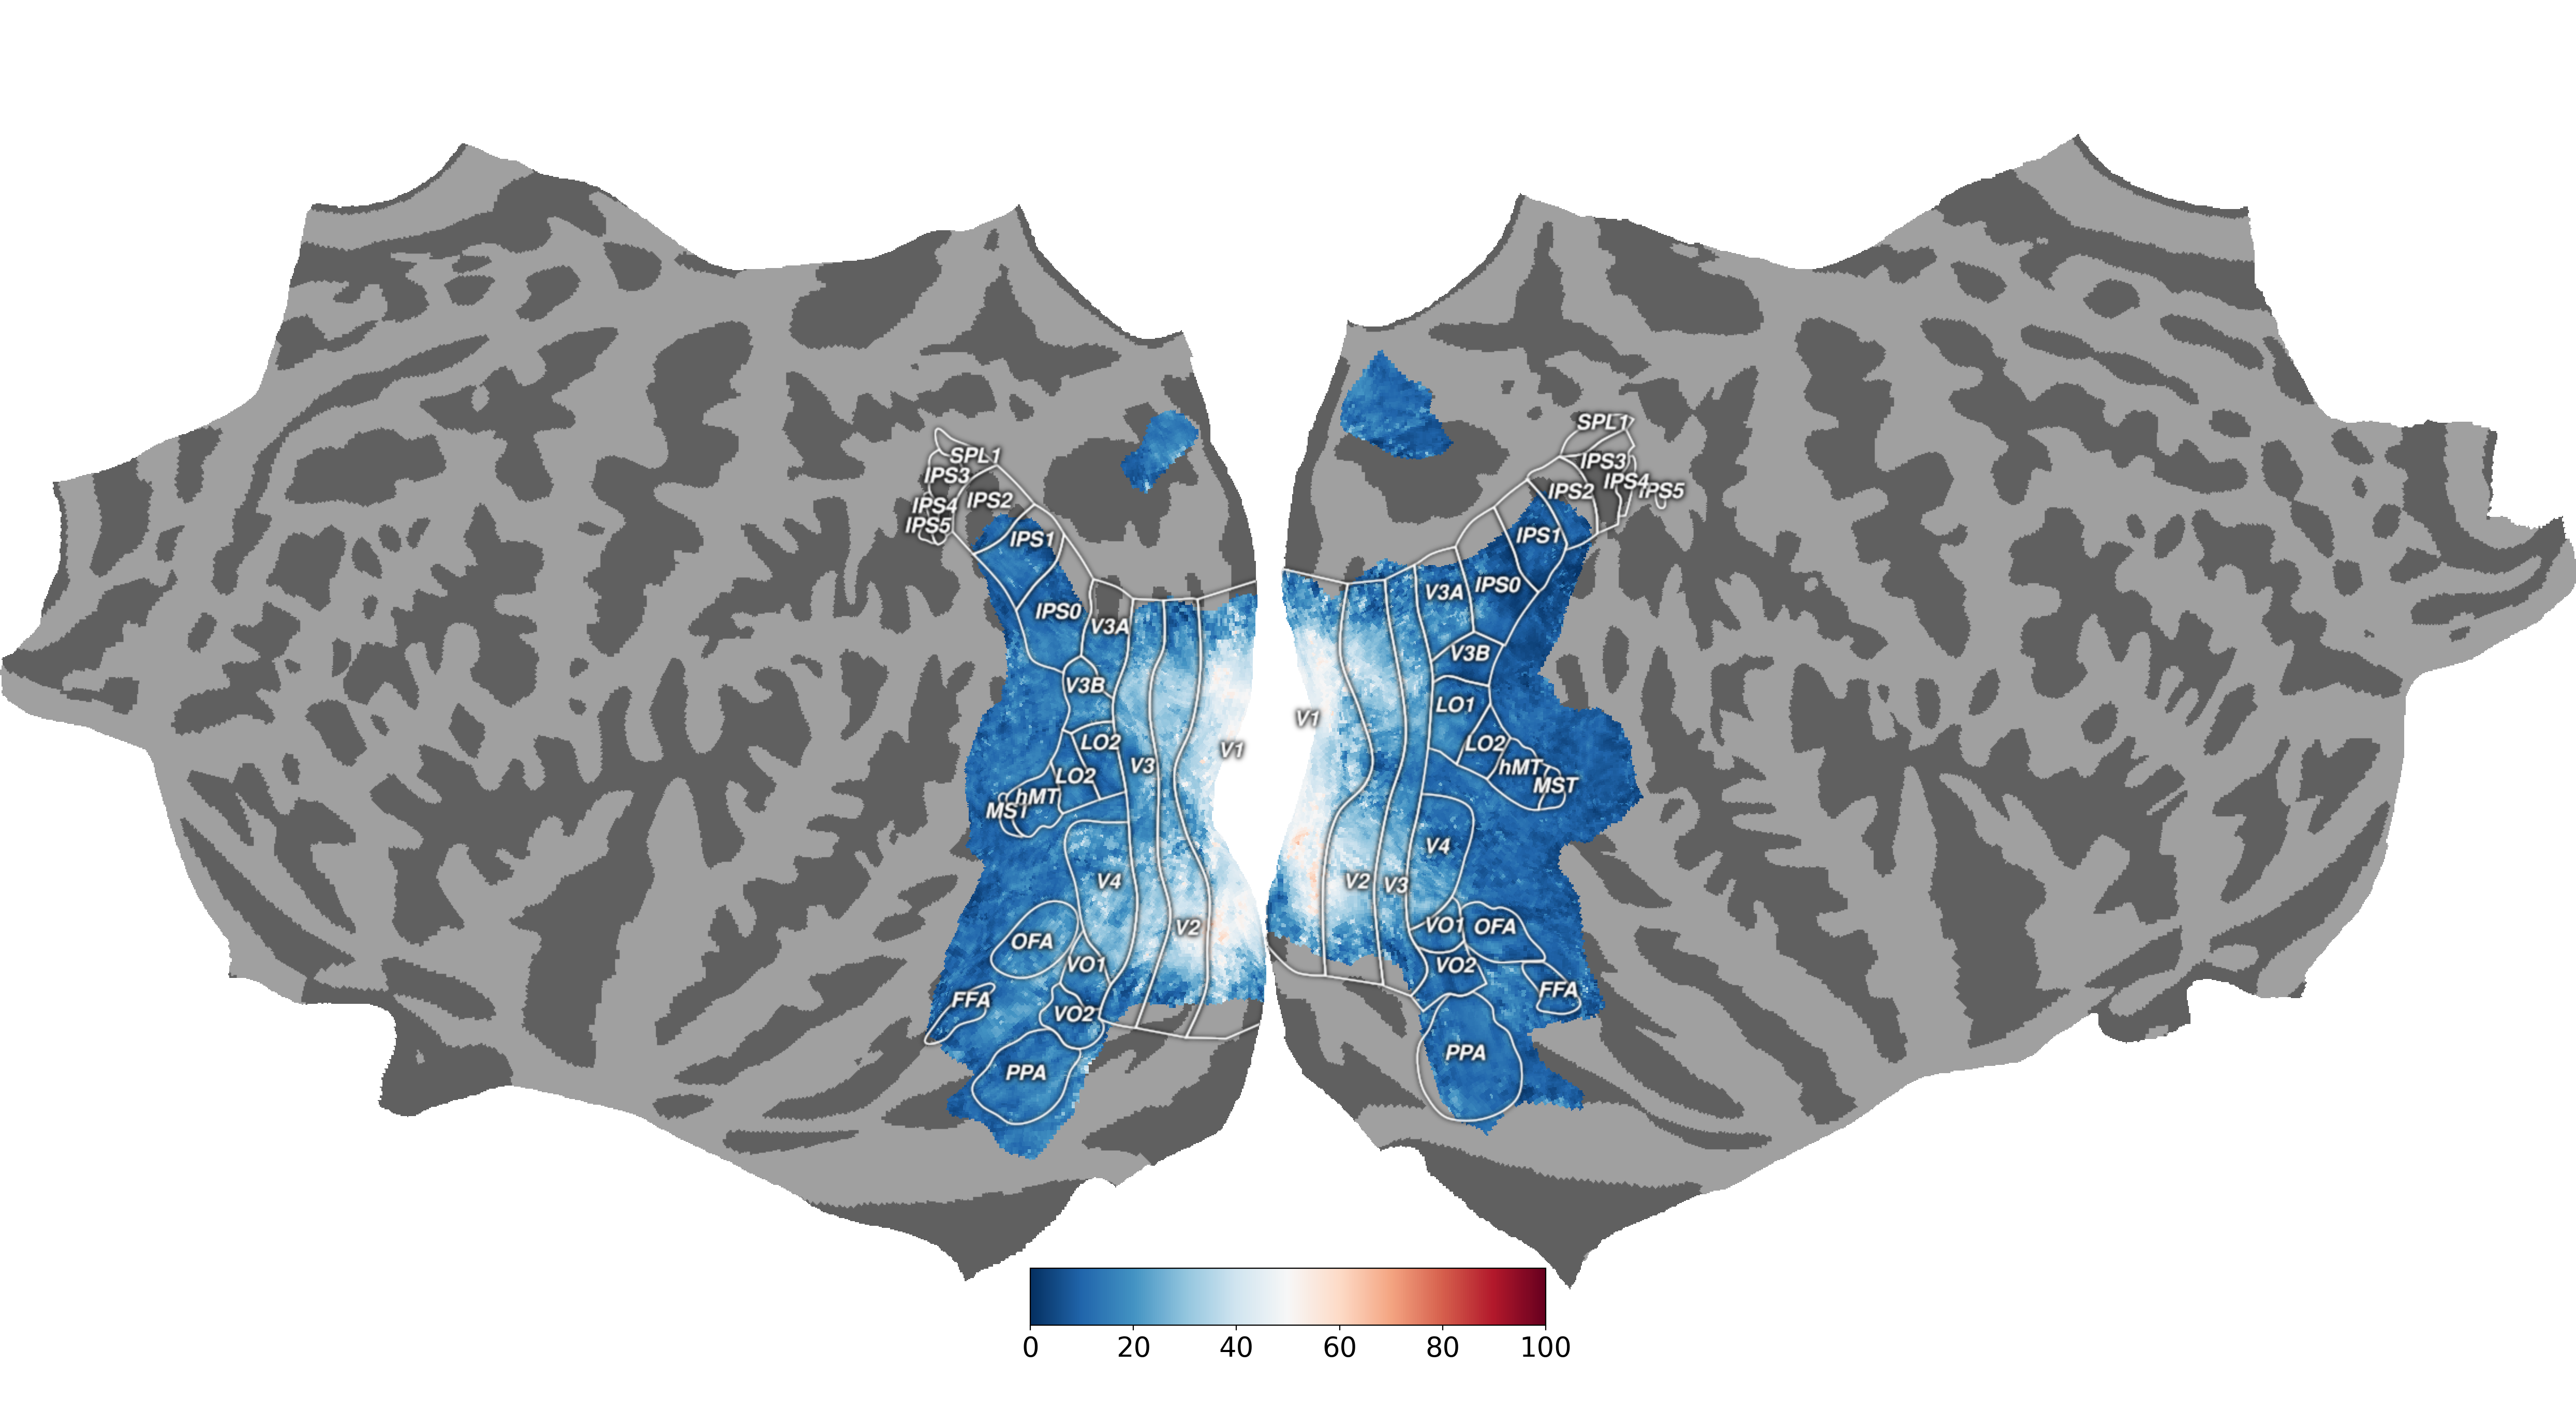
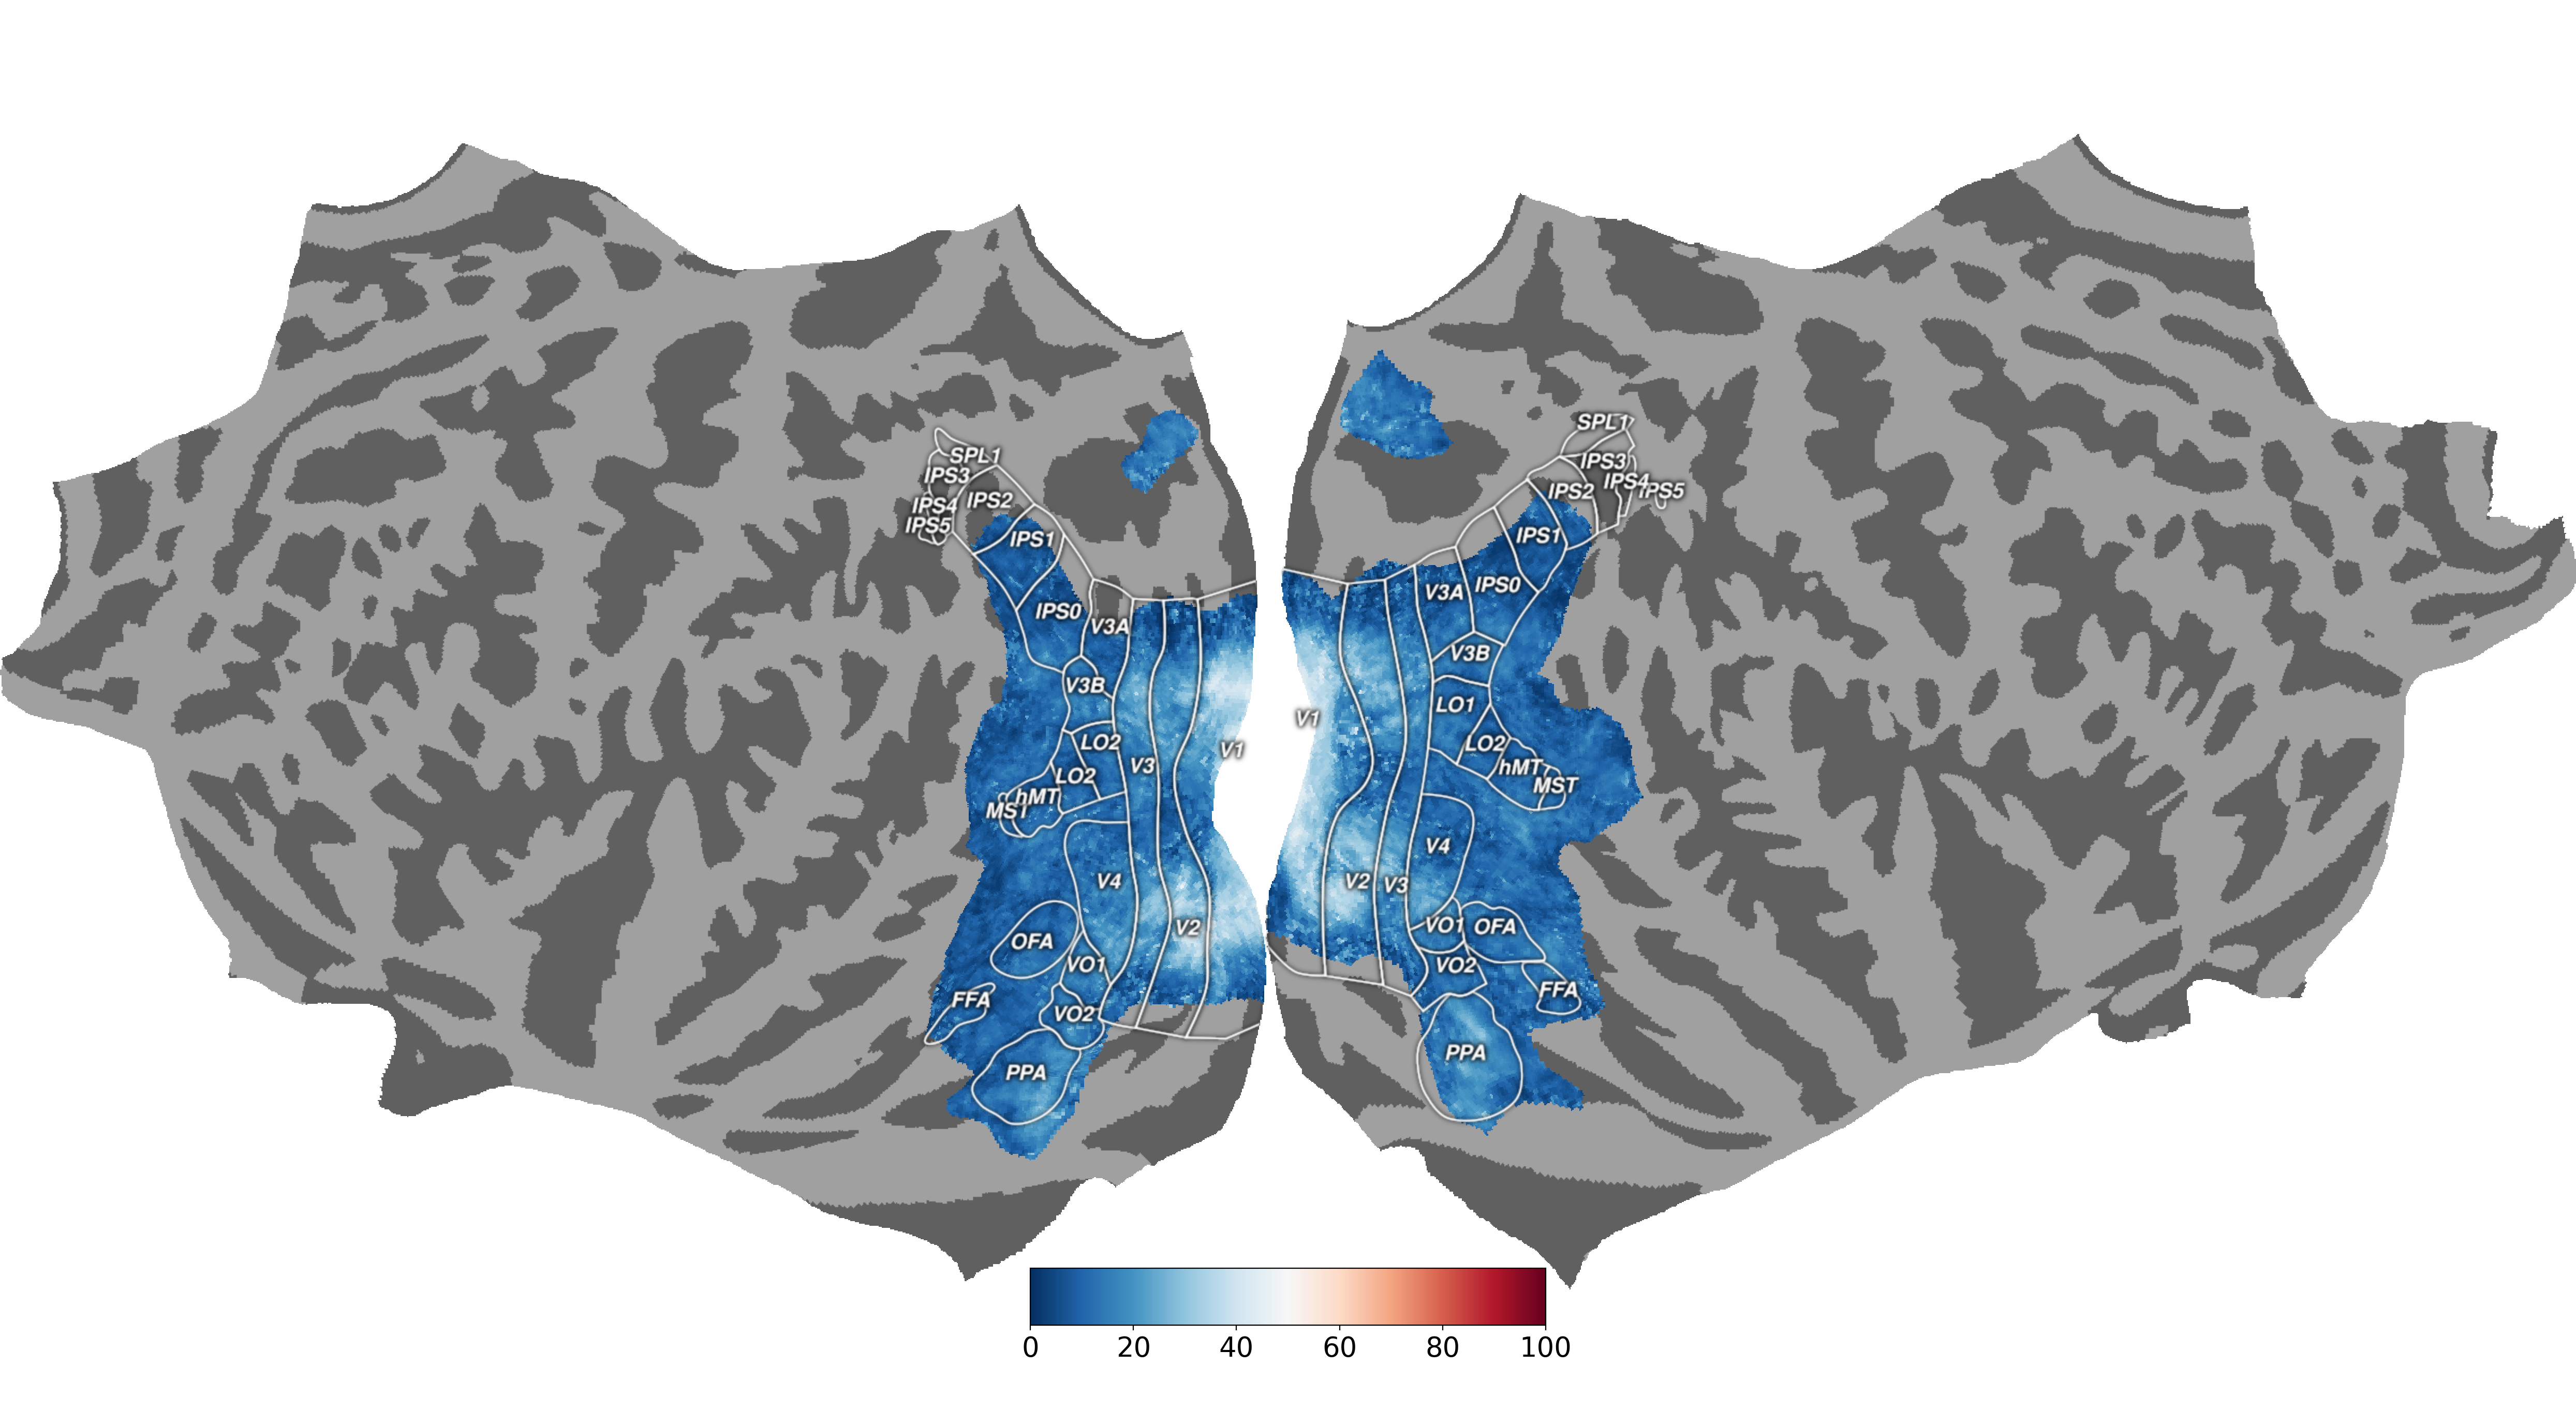
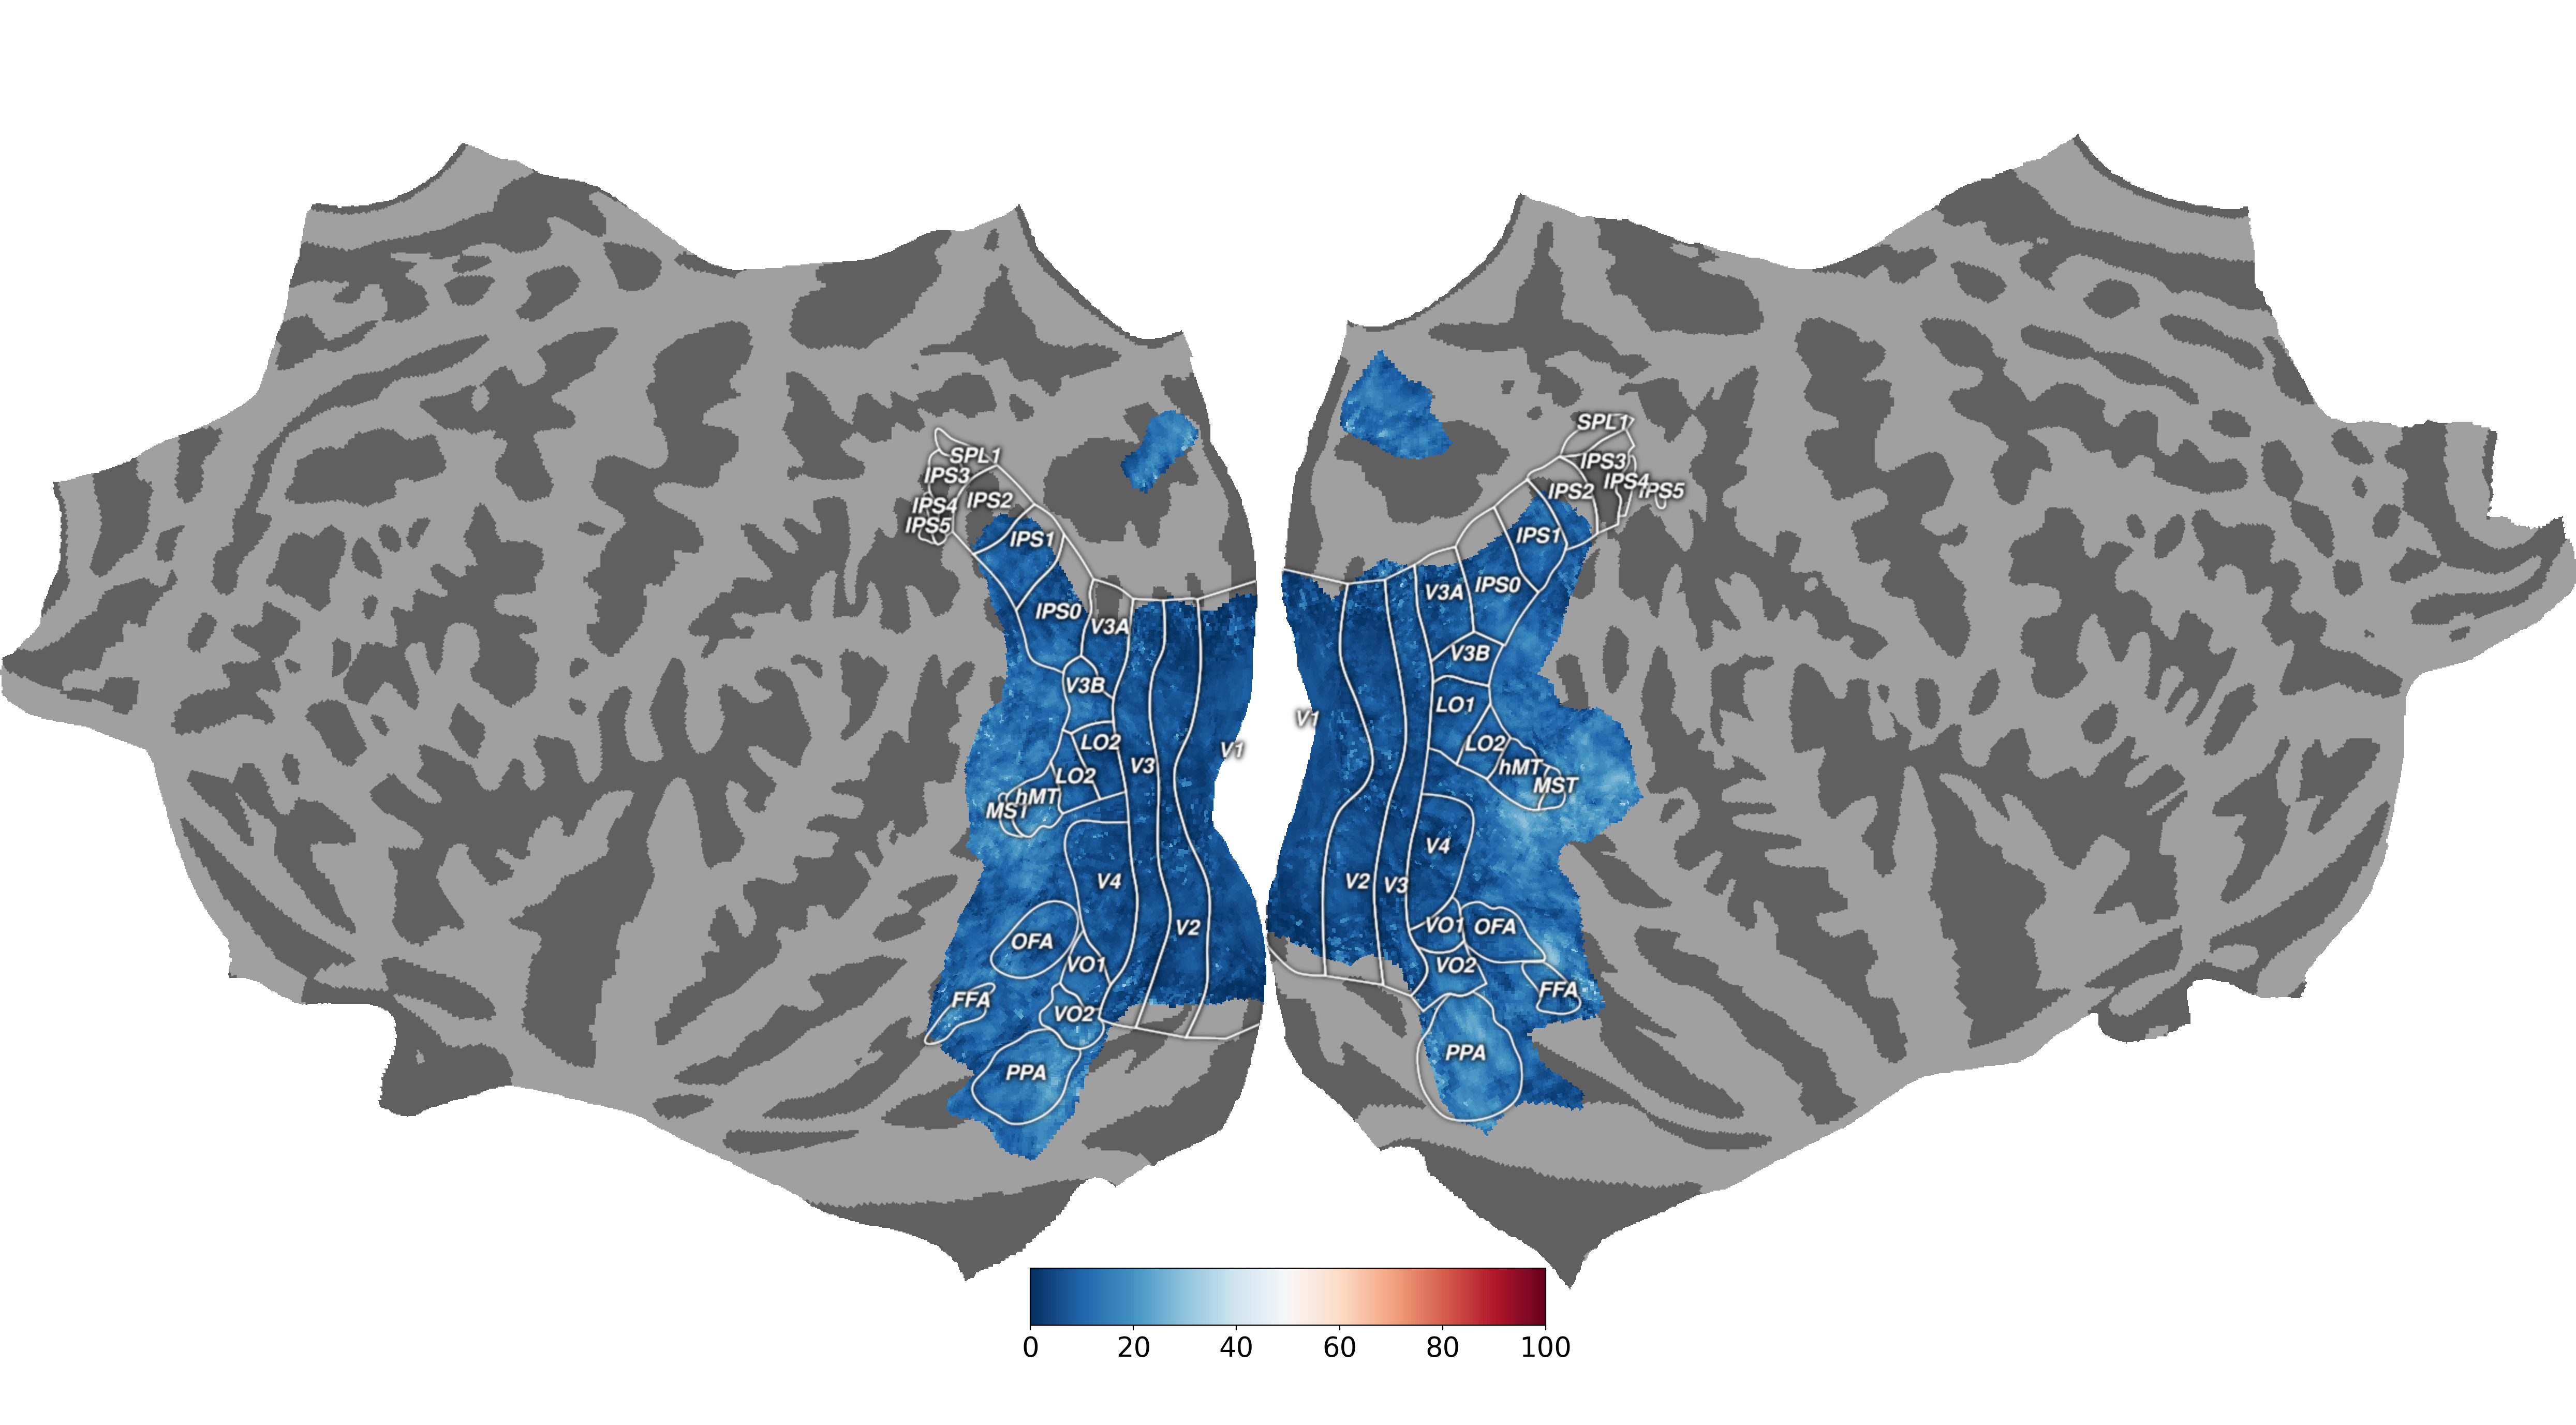
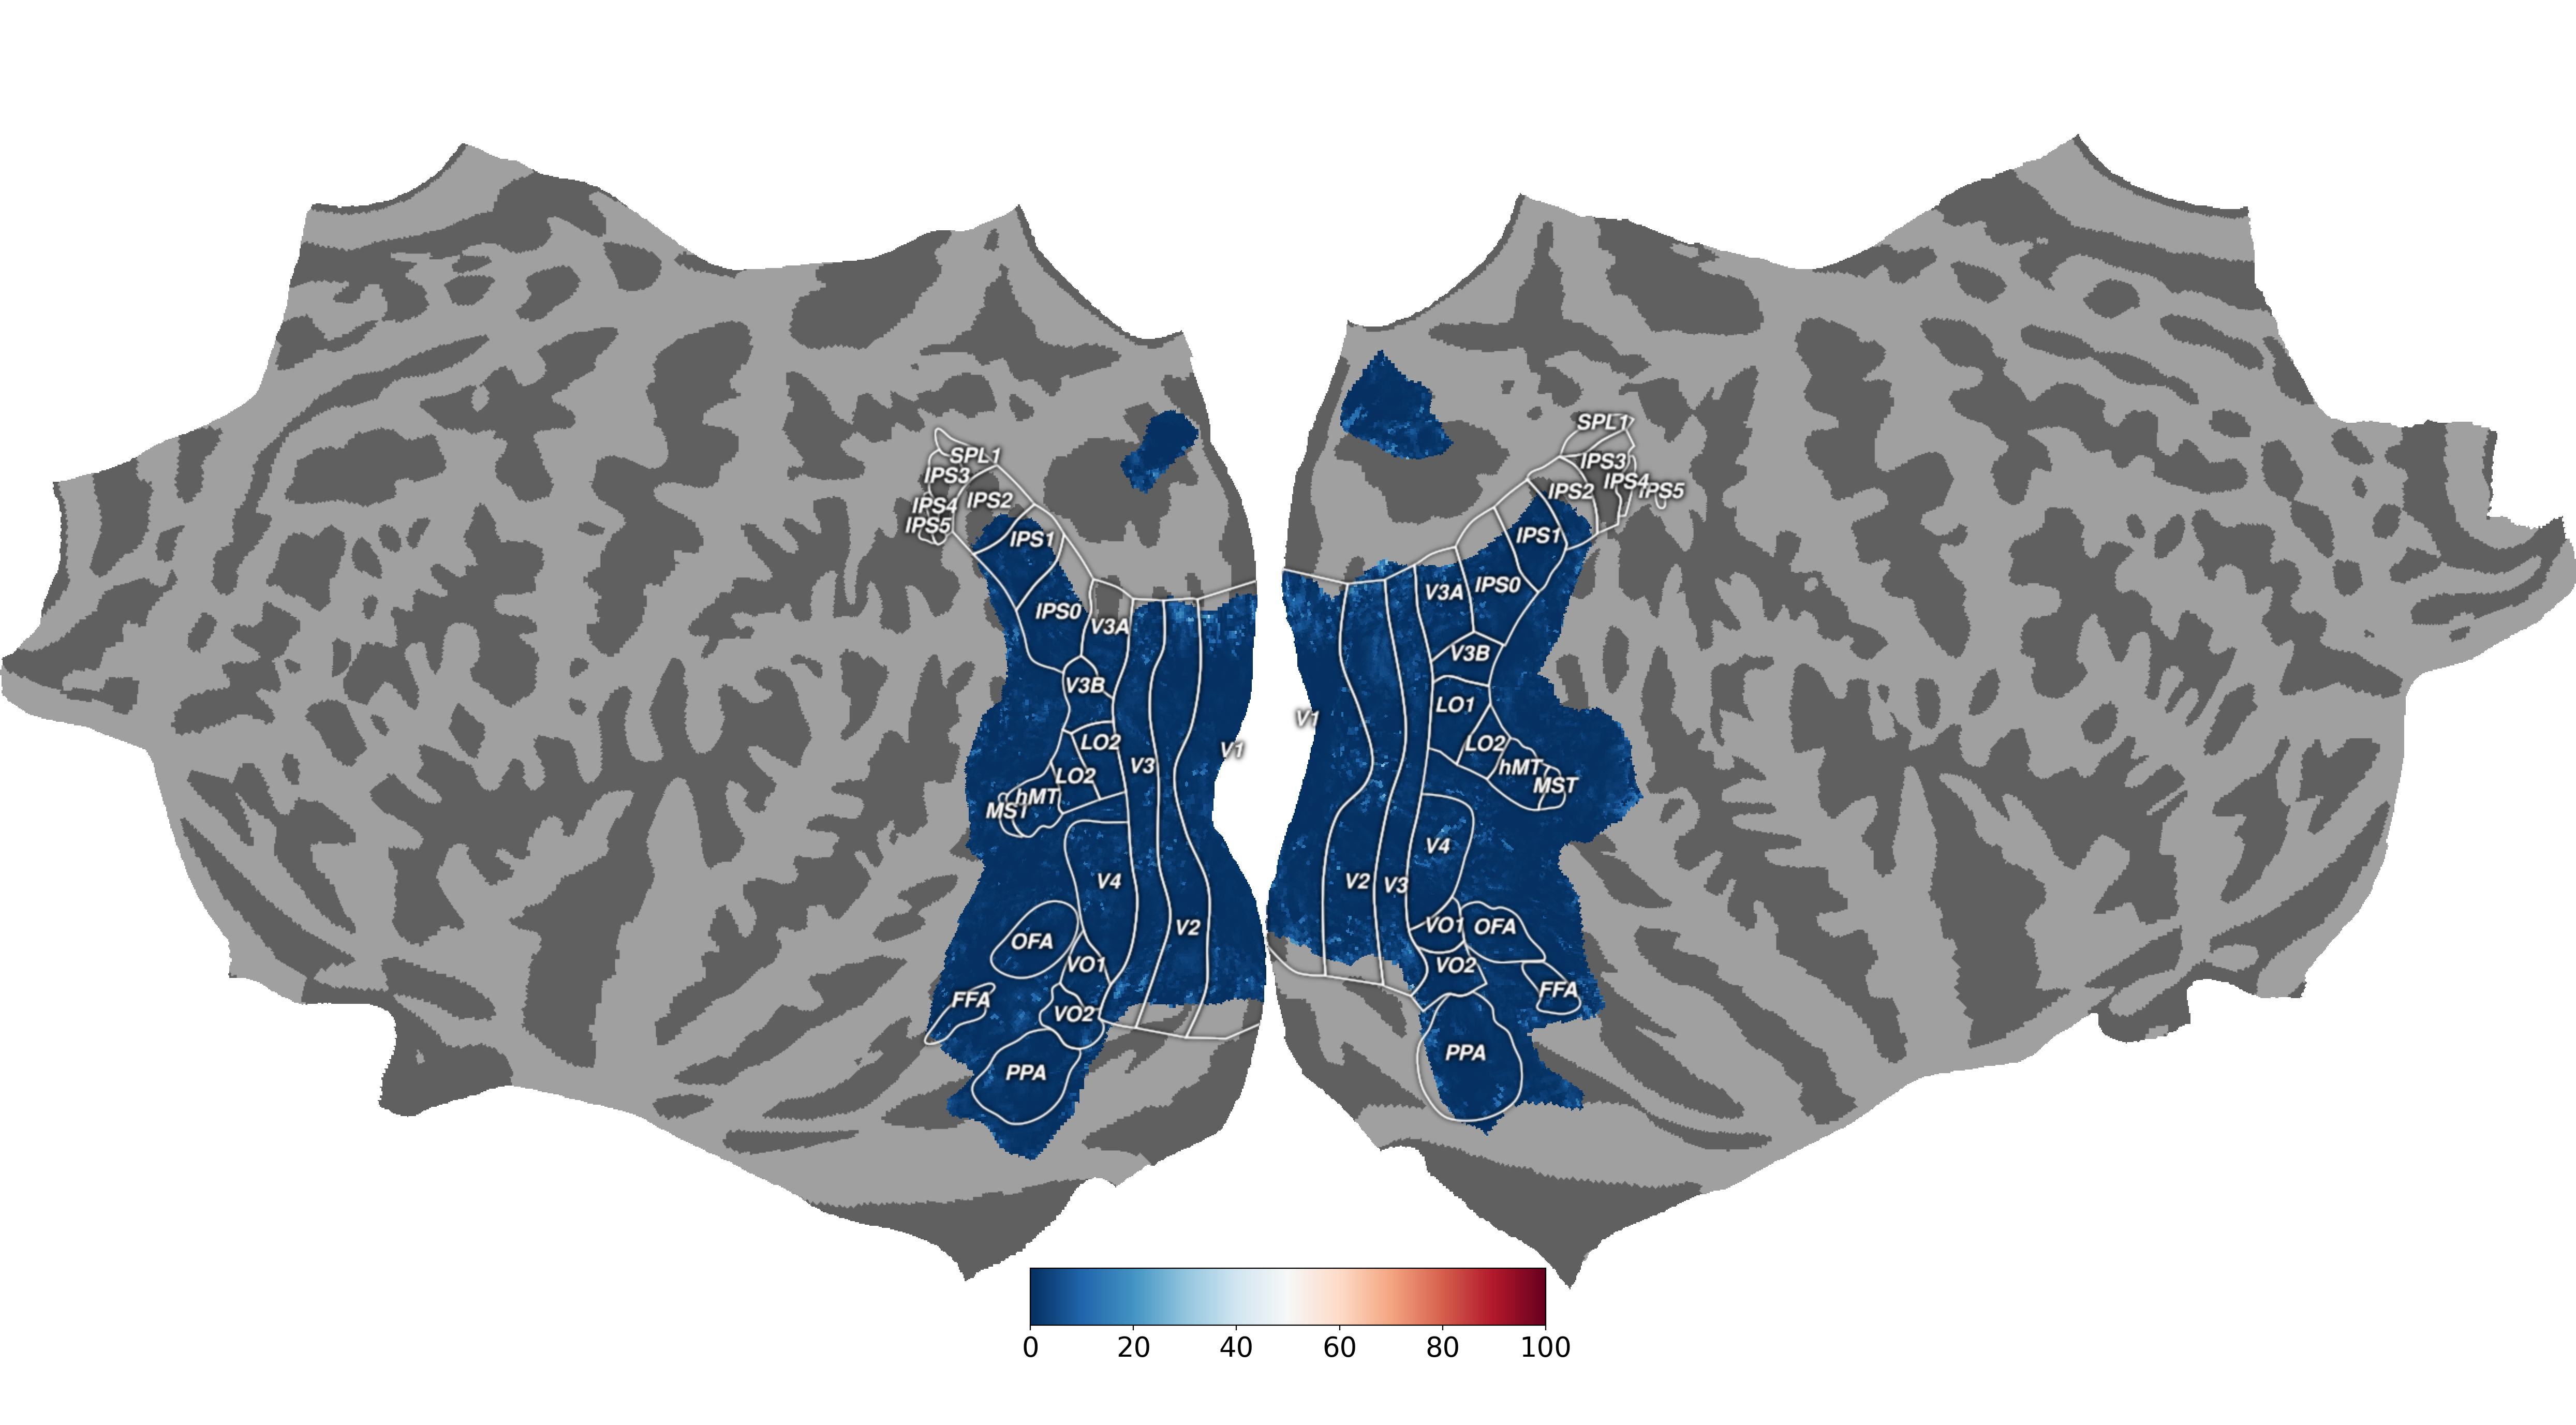
The goal of the Challenge is to predict brain responses across the whole visual brain. That is where the most reliable responses to images were found.
We provide i) a set of images and ii) the corresponding brain responses recorded while human participants viewed those images. With that, participants are expected to build computational models to predict brain responses for images which brain data we held out.
Participants submit predicted responses (for the provided set of brain surface vertices) in the format described in the development kit. We score the submission by measuring the predictivity for each vertex in the selected set for all the subjects and display the overall mean predictivity in the leaderboard calculated across all vertices and all subjects.
Download the data for the Algonauts Project 2023 Challenge
The visual cortex is divided into multiple areas having different functional properties, referred to as regions-of-interest (ROIs). Along with the fMRI data we provide ROI indices for selecting vertices belonging to specific visual ROIs, that Challenge participants can optionally use at their own discretion (e.g., to build different encoding models for functionally different regions of the visual cortex). However, the Challenge evaluation score is computed over all available vertices, and not over any single ROI. For the ROI definition please see the NSD paper. Note that not all ROIs exist in all subjects. Following is the list of ROIs provided (ROI class file names in parenthesis):
ROIs surface plots. Visualizations of subject 1 ROIs on surface plots. Different ROIs are represented using different colors. The names of missing ROIs are left in black.
We provide a Colab tutorial in Python where we take you all the way from data input to Challenge submission. In particular, we show you how to:
| Rank | Team Name | Challenge Score | Report | Code | Visualization |
|---|---|---|---|---|---|
| 1 | huze | 70.8473 | Report | Code | Visualization |
| 2 | hosseinadeli | 63.5229 | Report | Code | Visualization |
| 3 | UARK-SUNY-Albany | 61.5693 | Report | Code | Visualization |
| 4 | CYHSM | 60.8190 | Visualization | ||
| 5 | cvailab | 60.6817 | Visualization | ||
| 6 | BlobGPT | 60.2472 | Report | Code | |
| 7 | lisq | 59.6215 | Visualization | ||
| 8 | takuya | 59.2217 | Report | Code | Visualization |
| 9 | ashes | 58.7017 | Visualization | ||
| 10 | koelma | 58.6946 | Visualization | ||
| 11 | kyti | 58.6272 | |||
| 12 | grapeot | 57.6842 | |||
| 13 | ChanceLevel | 56.9884 | Visualization | ||
| 14 | zcboluo | 53.9323 | Visualization | ||
| 15 | skyboy23 | 53.9259 | Visualization | ||
| 16 | IVACoders | 53.6696 | Visualization | ||
| 17 | taru | 53.5135 | |||
| 18 | fractalencoders | 53.4228 | Visualization | ||
| 19 | PaulScotti | 52.2649 | Visualization | ||
| 20 | es123 | 52.0784 | Visualization | ||
| 21 | slavaheroes | 50.6321 | Report | Code | Visualization |
| 22 | LukeK | 49.1195 | |||
| 23 | RLeipe | 48.7589 | |||
| 24 | dpan | 48.7225 | Visualization | ||
| 25 | catosine | 48.4552 | |||
| 26 | Yinglab | 48.2846 | Visualization | ||
| 27 | Dandelion | 48.1315 | Visualization | ||
| 28 | q710572172 | 47.8408 | Visualization | ||
| 29 | Divyanshu-Bhatt | 47.6603 | |||
| 30 | skynet | 47.6533 | |||
| 31 | Rxliang | 47.6037 | |||
| 32 | iannwtf | 47.3071 | |||
| 33 | yunagi | 46.9504 | |||
| 34 | henry | 46.2651 | Report | Code | Visualization |
| 35 | matteoferrante | 45.2463 | |||
| 36 | jschubeck | 45.2193 | |||
| 37 | simoneazeglio | 44.4575 | |||
| 38 | MASS | 44.0524 | |||
| 39 | Yoshito | 43.9263 | |||
| 40 | artem9k | 43.0304 | |||
| 41 | ffan | 42.9663 | Visualization | ||
| 42 | random-walk | 42.5818 | Visualization | ||
| 43 | giorgiocarbone | 42.4919 | Code | ||
| 44 | Anonymous_user | 42.3535 | Visualization | ||
| 45 | neuro_enc | 42.2649 | |||
| 46 | ConvolutionalSlayers | 42.2471 | |||
| 47 | csng_team | 41.7998 | Visualization | ||
| 48 | ne | 41.7412 | |||
| 49 | ccc29 | 41.3450 | |||
| 50 | Roman_Beliy | 41.2527 | Visualization | ||
| 51 | kitahashi | 40.8347 | Visualization | ||
| 52 | OrganizerBaseline | 40.4222 | Visualization | ||
| 53 | flash00 | 40.3870 | |||
| 54 | BJ_Summer | 40.2981 | Visualization | ||
| 55 | aborovykh | 40.1590 | Visualization | ||
| 56 | Takuma.B | 40.1230 | |||
| 57 | Riccardo-Chimisso | 39.9926 | Report | Code | Visualization |
| 58 | s.m | 39.7824 | Visualization | ||
| 59 | vstark21 | 38.0716 | |||
| 60 | yzl18 | 37.3623 | Visualization | ||
| 61 | Kriti | 36.9284 | Visualization | ||
| 62 | mmxia | 36.8178 | Visualization | ||
| 63 | Mei | 36.7625 | Visualization | ||
| 64 | hwgu | 36.5715 | |||
| 65 | beizai | 36.4533 | Visualization | ||
| 66 | KatanaGirl | 36.1601 | Visualization | ||
| 67 | kadaj13 | 36.1601 | Visualization | ||
| 68 | qrx | 35.9656 | |||
| 69 | trungpham | 35.8158 | |||
| 70 | Yizhuo_Lu | 34.4342 | Visualization | ||
| 71 | jroth | 34.4181 | |||
| 72 | Flo2306 | 33.2701 | |||
| 73 | anp | 33.2054 | |||
| 74 | kawa | 32.9845 | |||
| 75 | qasymjomart | 32.4863 | Visualization | ||
| 76 | shinouta | 32.3211 | |||
| 77 | Cyb3rBlaze | 31.9342 | |||
| 78 | lightdisappear | 31.7650 | |||
| 79 | chandrakant | 31.6927 | |||
| 80 | Wenshuo | 31.6471 | |||
| 81 | ShijZ | 27.6497 | |||
| 82 | multivariate | 22.9256 | |||
| 83 | HomoDigitalis | 22.4356 | |||
| 84 | Cris | 21.8303 | |||
| 85 | Ryoto | 21.8115 | |||
| 86 | Subhrasankar | 21.5636 | Visualization | ||
| 87 | shuhei019 | 18.6579 | |||
| 88 | kuma | 18.6412 | |||
| 89 | goldy-fj | 17.8612 | |||
| 90 | XUJT | 17.5636 | |||
| 91 | alex12341 | 17.4030 | Visualization | ||
| 92 | shinji | 17.2762 | |||
| 93 | chenjuun | 16.7032 | |||
| 94 | nystrom | 14.9991 | |||
| 95 | chadyang | 14.6997 | |||
| 96 | tsneurotech | 14.5501 | |||
| 97 | advaith | 13.9676 | Visualization | ||
| 98 | atsuki | 13.3175 | |||
| 99 | ping | 10.4776 | |||
| 100 | contestant1 | 10.2275 | Visualization | ||
| 101 | cuikailong | 9.2913 | |||
| 102 | swest19 | 9.1866 | |||
| 103 | daochang-liu | 8.5897 | |||
| 104 | jajoosam | 5.2462 | |||
| 105 | annie_johansson | 2.9330 | |||
| 106 | contestant3 | 1.5685 | Visualization | ||
| 107 | bjmiao | 1.4248 |
The Algonauts Project 2023 Challenge Leaderboard. The Challenge Score is the mean noise-normalized encoding accuracy of our held-out brain data across the vertices of all subjects and hemispheres (see details). View the leaderboard on CodaLab here.
To determine how well your models encode brain responses (i.e., the models' encoding accuracy) we compare your submitted predicted brain data (the one predicted by your model to the left out test images) to the empirically measured brain responses. Specifically, we (1) correlate the predicted test fMRI data with the corresponding ground truth fMRI data (across image conditions, independently for each vertex), (2) square the correlation coefficients of each vertex, and (3) normalize the resulting value of each vertex by its noise ceiling. Your leaderboard ranking metric is determined by the mean noise-normalized encoding accuracy across all the vertices of all subjects and hemispheres:


where ν is the index of vertices (over all subjects and hemispheres), t is the index of the test stimuli images, G and P correspond to, respectively, the ground truth and predicted fMRI test data, Ḡ and P̄ are the ground truth and predicted fMRI test data averaged across test stimuli images, R is the Pearson correlation coefficient between G and P, and NC is the noise ceiling.
There are different ways to predict brain data using computational models. We put close to no restrictions on how you do so (see Challenge Rules). However, a commonly used approach is to use linearizing encoding models, and we provide a development kit to implement such a model.
1. Participants can make a maximum of 3 submissions per day and 250 submissions over the entire competition. Each challenge participant can only compete using one account. Creating multiple accounts to increase the number of possible submissions will result in disqualification to the challenge.
2. Participants can use any (external) data for model building and any model. However, participants that use the test set for training will be disqualified (in particular brain data generated using the test set). Also, if you ever had access to the fMRI test data you cannot participate in the challenge.
3. Participants should be ready to upload a short report (~4-8 pages) describing their model building process for their best model to a preprint server (e.g. bioRxiv, arXiv) and send the PDF or preprint link to the organizers by filling out this form. You must submit the Challenge report by the Challenge report submission deadline to be considered for the evaluation of challenge outcomes. While all reports are encouraged to link to their code (e.g. GitHub), sharing code is mandatory for the top three submissions. Participants that do not make their approach open and transparent cannot be considered.
| Train data, test stimuli, and development kit released: | January 14th, 2023 |
| Challenge submission deadline: | July 26th, 2023 at 11:59pm (UTC-4) |
| Challenge report/code submission deadline: | August 2nd, 2023 |
| Challenge results released: | August 10th, 2023 |
| Sessions at CCN 2023: | August 25–26th, 2023 |
If you participate in the Challenge, use this form to submit the Challenge report and code.
This research was funded by DFG (CI-241/1-1, CI241/1-3,CI-241/1-7) and ERC grant (ERC-2018-StG) to RMC; NSF award (1532591) in Neural and Cognitive Systems, the Vannevar Bush Faculty Fellowship program funded by the ONR (N00014-16-1-3116) and MIT-IBM Watson AI Lab to AO; the Alfons and Gertrud Kassel foundation to GR. Collection of the NSD dataset was supported by NSF IIS-1822683 and NSF IIS-1822929.