Brain Response Measurement: fMRI
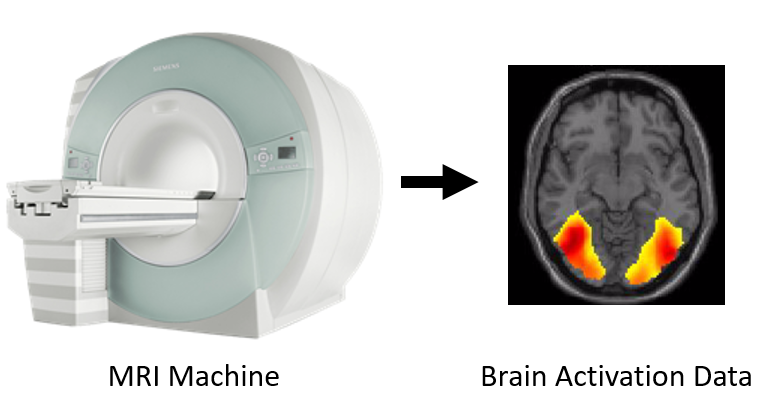
We provide measurements of brain responses using the technique of functional magnetic resonance imaging (fMRI) for millimeter spatial resolution. This technique measures brain activity indirectly by detecting changes in blood flow associated with brain activity. fMRI is a core technique in cognitive neuroscience to observe the human brain in action noninvasively.
Experimental Paradigm
Each of the ten participants completed five separate scanning sessions. The first scanning session consisted of a
localizer experiment, where participants passively viewed short videos (distinct from the 1,102 test/train videos in the
main experiment) belonging to various categories (such as faces, bodies, objects, scenes, and scrambled videos). The
brain data obtained from this localizer experiment was used to define the location of the visual ROIs in each subject
and is otherwise unrelated to the main experiment (ROI Masks figure).
The remaining four sessions consisted of the main experiment and followed an identical structure. For each of the four remaining sessions,
participants were instructed to focus on a fixation cross at the center of the screen while they passively viewed the 3
second training and testing set videos without audio. The videos were presented in 13 separate runs, with each run lasting about 7
minutes and consisting only of either training videos or testing videos. By the end of the four main experiment
sessions, each participant viewed each of the 1,000 training videos 3 times and each of the 102 testing videos 10 times.
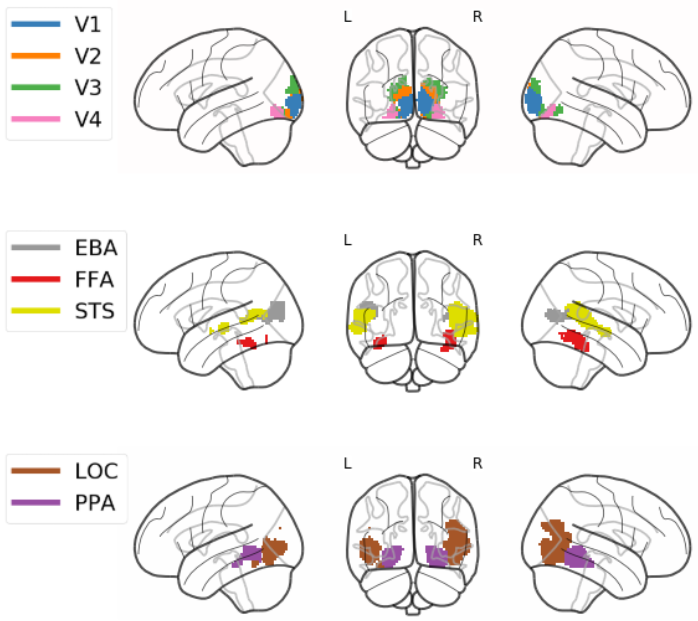
ROI Masks: Using our localizer experiment, we functionally defined nine non-overlapping ROIs for each of the ten participants. These ROIs span the ventral visual pathway from early and mid-level visual cortex (V1, V2, V3, and V4) to higher-level regions responding preferentially to objects and object categories (Body - EBA; Face - FFA, STS; Object - LOC; Scene - PPA). Here we show the ROIs for a representative participant.
Recording Parameters
The MRI data were acquired with a 3T Trio Siemens scanner with the following acquisition parameters: TR = 1750 ms, resolution = 2.5 mm x 2.5 mm x 2.5 mm, slices = 54, multi-band acceleration factor = 2, ascending interleaved acquisition. The acquisition parameters were identical across the localizer, training, and testing runs.
Preprocessing
The data was organized according to standard BIDS format and preprocessed using the fMRIprep preprocessing pipeline. The pipeline includes slice time correction, realignment, co-registration, and normalization to MNI space (for more fMRIprep pipeline details, see here). We then used a custom MATLAB script to interpolate (pchip method) the data from the collected TR=1750ms to TR=1000ms to vary the time point at which the BOLD response was sampled for each video. Data quality measures were generated using MRIQC and can be found here.
Analysis Parameters
We modeled the BOLD-signal of each voxel in the preprocessed and interpolated fMRI data of each participant as a
weighted combination of simple Finite Impulse Response (FIR) basis functions. We modeled the BOLD response with
respect to each video onset from 5 to 9 seconds in 1 second steps (corresponding to the resolution of the resampled
time series).
Using FIR in the way described above, we modeled every trial in the experimental run of each session. For every
session we generated separate FIR models for training and test sets. Overall, for each video condition in the test
set we extracted 10 (repetitions) x 5 (seconds) estimated beta values and in the training set 3 (repetitions) x 5
(seconds) beta estimates. The estimated beta values were averaged across time resulting in a single averaged beta
value for each video presentation. The extracted betas entered further analysis using an encoding model, either as
defined in ROIs or for the whole brain.
Whole Brain Encoding
The whole brain beta values for each video condition (10 repetitions = 10 betas for each testing video and 3 repetitions = 3 betas for each training video) were masked with the reliable voxels (determined by split-half reliability). To estimate split-half reliability, the voxel responses to test videos were split into all possible combinations of two splits of 5 repetitions each and Pearson's correlation (ρ) was calculated between the splits. The split-half reliability was then calculated using Spearman-Brown formula (2ρ/(1+ρ)) and by averaging the reliability across all combinations of splits. The remaining reliable beta values were used as the encoding model prediction data for the Full Track.
ROI Encoding
The whole brain beta values for each video condition (10 repetitions = 10 betas for each testing video and 3
repetitions = 3 betas for each training video) were first masked with the non-overlapping subject-specific ROI mask
to extract only the beta values within the ROI. Next, the ROI beta values were masked with the reliable voxels
within the ROI (determined by split-half reliability). The remaining reliable beta values within the ROI were used
as the encoding model prediction data for the appropriate Mini Track.
Click here to learn more about voxel-wise encoding