Competition Tracks
The main goal of the Algonauts Project 2021 Challenge is to use computational models to predict brain responses recorded while participants viewed short video clips of everyday events.
We provide functional MRI data collected from 10 human subjects that watched over 1,000 short video clips.
Please click here to learn more about the fMRI brain mapping and analysis that we conducted.
There are 2 challenge tracks: the Mini Track and
the Full Track. The Mini
Track
focuses on pre-specified regions of the visual brain known to play a key role in visual processing. The Full Track considers
responses across the whole brain. Participants can play in the Mini Track, Full Track, or both.
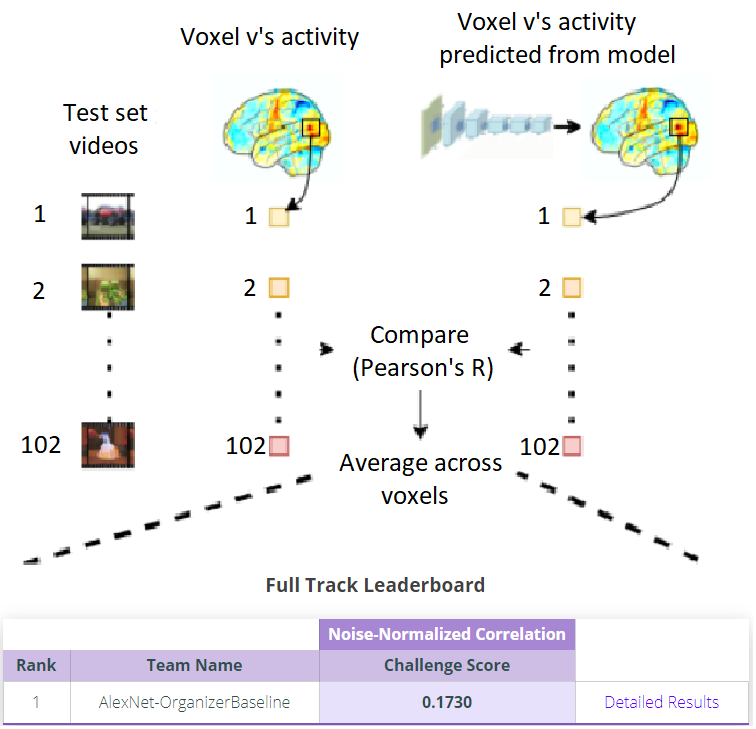
The task is: Given a) the set of videos of everyday events and b) the corresponding brain responses recorded while human participants viewed those videos, use computational models to predict brain responses for videos for which we held out brain data.
Mini Track (9 ROIs)
The goal of the Mini Track is to predict brain responses in specific regions of interest (ROIs), that is pre-specified regions of the brain known to play a key role in visual perception. Participants submit the predicted brain responses for each ROI in the format described in the development kit. We score the submission by measuring the predictivity for each voxel in all the ROIs for all the subjects and show the overall mean predictivity in the leaderboard calculated across voxels, ROIs, and subjects.
We provide the following data for the Mini Track (download here):
-
Training Set
1,000 3-second videos + fMRI human brain data of 10 subjects in response to viewing muted videos from this set. The data is provided for 9 ROIs of the visual brain (V1, V2, V3, V4, LOC, EBA, FFA, STS, PPA) in a Pickle file (e.g. V1.pkl) that contains a num_videos x num_repetitions x num_voxels matrix. For each ROI, we selected voxels that showed significant split-half reliability. -
Test Set
102 3-second videos only (.mp4 format). -
Development Kit
We provide a development kit to obtain baseline performance provided in the leaderboard. It consists of Python scripts to: - Extract activations of a computational model (AlexNet) in response to video clips.
- Train a voxel-wise encoding model using AlexNet activations to predict brain responses, and to evaluate the encoding model using cross-validation on the training data.
- Prepare the predicted brain responses from the trained encoding model in the format required for submission to the challenge.
Mini Track Leaderboard (Official 2021 Challenge Results)
| Noise-Normalized Correlation | ||||||||||||
|---|---|---|---|---|---|---|---|---|---|---|---|---|
| Rank | Team Name | Challenge Score | V1 | V2 | V3 | V4 | LOC | EBA | FFA | STS | PPA | |
| 1 | huze | 0.7110 | 0.7063 | 0.7084 | 0.7025 | 0.7412 | 0.7320 | 0.7693 | 0.8059 | 0.5989 | 0.6345 | Report |
| 2 | bionn | 0.6490 | 0.6497 | 0.6564 | 0.6495 | 0.6862 | 0.6950 | 0.7129 | 0.7161 | 0.4930 | 0.5820 | Report |
| 3 | shinji | 0.6208 | 0.6557 | 0.6308 | 0.6038 | 0.6208 | 0.6570 | 0.6748 | 0.6654 | 0.4970 | 0.5816 | Report |
| 4 | Hc33 | 0.5917 | 0.5594 | 0.5525 | 0.5469 | 0.5901 | 0.6491 | 0.6649 | 0.6999 | 0.4971 | 0.5653 | Report |
| 5 | rob_the_builder | 0.5884 | 0.5835 | 0.5530 | 0.5484 | 0.5894 | 0.6259 | 0.6574 | 0.7128 | 0.4877 | 0.5376 | Report+Code |
| 6 | Aakashagr | 0.5843 | 0.5812 | 0.5507 | 0.5397 | 0.5529 | 0.6411 | 0.6512 | 0.7213 | 0.4927 | 0.5276 | |
| 7 | NeuBCI | 0.5760 | 0.5300 | 0.4999 | 0.5509 | 0.5510 | 0.6370 | 0.6462 | 0.7347 | 0.5168 | 0.5176 | |
| 8 | arnenix | 0.5715 | 0.6323 | 0.6172 | 0.5668 | 0.5454 | 0.5680 | 0.5299 | 0.6969 | 0.4727 | 0.5146 | |
| 9 | michaln | 0.5710 | 0.4985 | 0.5019 | 0.5223 | 0.5801 | 0.6472 | 0.6470 | 0.7074 | 0.4842 | 0.5504 | Report |
| 10 | rematchka | 0.5674 | 0.5830 | 0.5678 | 0.5421 | 0.5521 | 0.6117 | 0.6172 | 0.6566 | 0.4588 | 0.5169 | Report |
| 11 | ikeroulu | 0.4527 | 0.3865 | 0.3895 | 0.4159 | 0.4539 | 0.5385 | 0.5440 | 0.5626 | 0.3726 | 0.4104 | |
| 12 | Mukesh | 0.4521 | 0.3955 | 0.3867 | 0.4100 | 0.4102 | 0.4786 | 0.5097 | 0.5935 | 0.4418 | 0.4427 | |
| 13 | Aryan120804 | 0.4491 | 0.3421 | 0.3424 | 0.3618 | 0.3957 | 0.5255 | 0.5442 | 0.6368 | 0.4419 | 0.4518 | Report |
| 14 | sricharan92 | 0.4448 | 0.5202 | 0.5016 | 0.4779 | 0.4681 | 0.4269 | 0.4454 | 0.4808 | 0.3154 | 0.3674 | |
| 15 | lingfei | 0.4397 | 0.4743 | 0.4510 | 0.4074 | 0.4117 | 0.4755 | 0.5065 | 0.5021 | 0.3484 | 0.3806 | |
| 16 | AlexNet-OrganizerBaseline | 0.4198 | 0.4444 | 0.4340 | 0.4052 | 0.4275 | 0.4391 | 0.4439 | 0.5041 | 0.3324 | 0.3478 | |
Each brain region is scored based on their noise-normalized correlation with our held-out brain data. The challenge
score is the average noise-normalized correlation across all 9 brain regions.
(See the ongoing Mini Track leaderboard here =>
click the blue "Challenge Phase" box)
Full Track (Whole Brain)
The goal of the Full Track is to predict brain responses across the whole brain. Participants submit predicted whole-brain responses (for the provided set of reliable voxels) in the format described in the development kit. We score the submission by measuring the predictivity for each voxel in the selected set for all the subjects and display the overall mean predictivity in the leaderboard calculated across all voxels and all subjects.
We provide the following data for the Full Track (download here):
-
Training Set
1,000 3-second videos + fMRI human brain data of 10 subjects in response to viewing muted videos from this set. The data is provided for selected voxels across the whole brain showing reliable responses to videos in a Pickle file (e.g. WB.pkl) that contains a num_videos x num_repetitions x num_voxels matrix. We also provide subject specific masks to visualize which voxels were selected. -
Test Set
102 3-second videos only (.mp4 format). -
Development Kit
We provide a development kit to obtain baseline performance provided in the leaderboard. It consists of Python scripts to: - Extract activations of a computational model (AlexNet) in response to video clips.
- Train a voxel-wise encoding model using AlexNet activations to predict brain responses, and to evaluate the encoding model using cross-validation on the training data.
- Visualize the data in brain space (MNI standard space).
- Prepare the predicted brain responses from the trained encoding model in the format required for submission to the challenge.
Full Track Leaderboard (Official 2021 Challenge Results)
| Noise-Normalized Correlation | ||||
|---|---|---|---|---|
| Rank | Team Name | Challenge Score | ||
| 1 | huze | 0.3733 | 3D Visualization | Report |
| 2 | bionn | 0.3490 | 3D Visualization | Report |
| 3 | shinji | 0.3395 | 3D Visualization | Report |
| 4 | Hc33 | 0.3225 | 3D Visualization | Report |
| 5 | michaln | 0.3117 | 3D Visualization | Report |
| 6 | han_ice | 0.3109 | ||
| 7 | Aakashagr | 0.2993 | ||
| 8 | rematchka | 0.2641 | ||
| 9 | lingfei | 0.2401 | ||
| 10 | ikeroulu | 0.2079 | ||
| 11 | ernest.kirubakaran | 0.2060 | ||
| 12 | AlexNet-OrganizerBaseline | 0.2035 | 3D Visualization |
The challenge score is the average noise-normalized correlation with our held-out brain data across all voxels.
(See the ongoing Full Track leaderboard here =>
click the blue "Challenge Phase" box)


